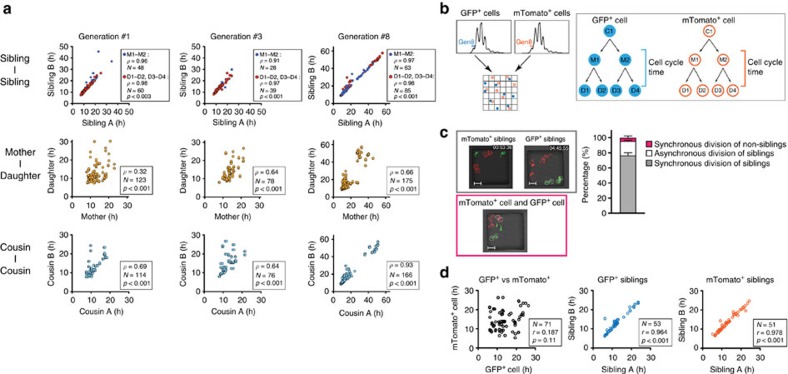
Figure 6. Cell cycle time regulation is shared by progenies in kinship.
(a) Correlation analysis of cell cycle times between ‘siblings’ (top), ‘mother–daughter’ (middle) and ‘cousins’ (bottom) from sorted 1st, 3rd and 8th generations. Data are cumulative of three independent experiments from Fig. 4. Significance of correlation was determined by Spearman’s rank correlation coefficient (ρ), significance (P) and number of events (N). (b) Scheme shows the strategy for sorting and tracking of non-relative GFP+ or membrane-tdTomato+ (mTomato+) cells from their respective 8th generations. (c) Left: representative snapshots with synchronous divisions of two mTomato+ or two GFP+ cells (top) or with a mTomato+ and a GFP+ cell (bottom) (scale bar, 10.0 μm). Right: frequency of observed division types. Data are cumulative from three independent experiments. Bars represent mean±s.d. (N=45). (d) Correlation analysis of cell cycle times between GFP+ and mTomato+ cells. Data are cumulative from three independent experiments. Significance of correlation was determined by Spearman’s rank correlation coefficient (ρ), significance (P) and number of events (N).

