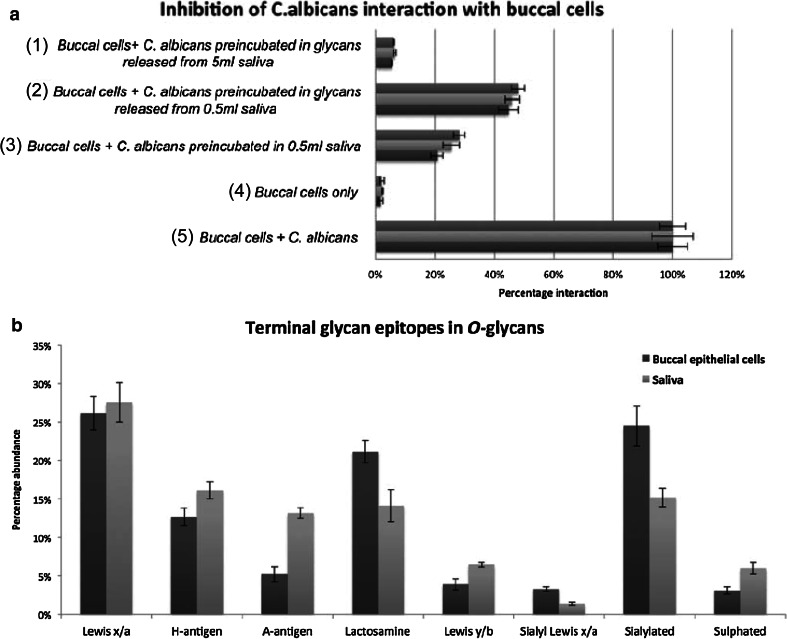
Fig. 4.
Flow cytometry-based assay to quantify the adhesion of Candida albicans to BEC. a5 shows the adhesion of C. albicans to BEC normalized to 100 % and a4 the corresponding autofluorescence of BEC only. The inhibition of interaction was analyzed after incubation with 0.5 mL of whole saliva a3, N- and O-glycans released from 0.5 mL saliva a2 and N- and O-glycans released from 5 mL saliva a1. Salivary glycans as well as whole saliva inhibits binding of C. albicans to BEC. The graph contains the mean ± standard error of three independent biological replicates and their technical triplicates. (b) shows relative intensities of glycan epitopes from O-glycans of salivary and BEC membrane proteins, which express similar glycan epitopes in different relative intensities. Relative quantification was performed on MS ion intensities of all glycans carrying these epitopes. The graph contains the mean ± standard error of three technical replicates of both saliva and BEC collected from an individual of blood group A secretor status [44]. © Oxford University Press

