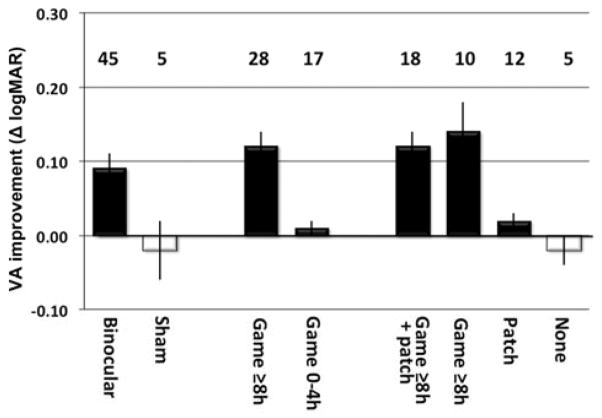
FIG 1.
Left, Mean (±SE) change in logMAR visual acuity (baseline minus 4-week outcome) with binocular iPad and sham iPad game play. Middle, Mean change in logMAR visual acuity for children who reported playing the binocular iPad games ≥8 hours (≥50% compliance) and children who reported 0–4 hours (≤25% compliance). Right, Mean change in logMAR visual acuity for children who played the binocular iPad games ≥8 hours and patched for 2 hours per day at a different time of day (game+patch), children who played the binocular iPad games ≥8 hours (game only) and did not patch, children who did not play the binocular iPad games but patched (Patch only), and children who did not play the binocular iPad games or patch (None). Positive values indicate that visual acuity improved. Vertical lines on each bar show standard errors. Numbers above the bars indicate the sample size in each group.

