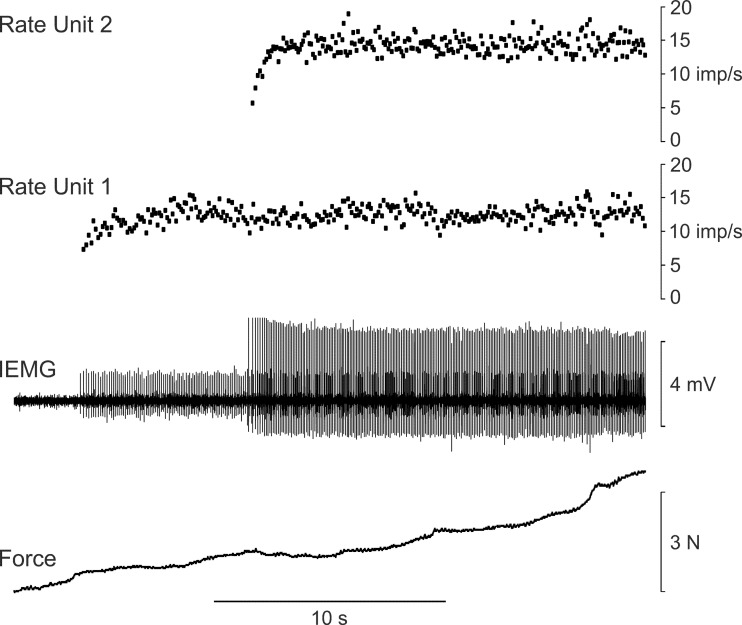
Fig. 2.
Example recording depicting firing rate saturation in 2 MUs. Isometric force (bottom trace), IEMG signal (middle trace), and instantaneous firing rates of the 2 units detected in the IEMG signal (top traces). The firing rates of both units leveled off despite continued increase in muscle force. In addition, unit 2 was recruited at a time when the firing rate of unit 1 had saturated.

