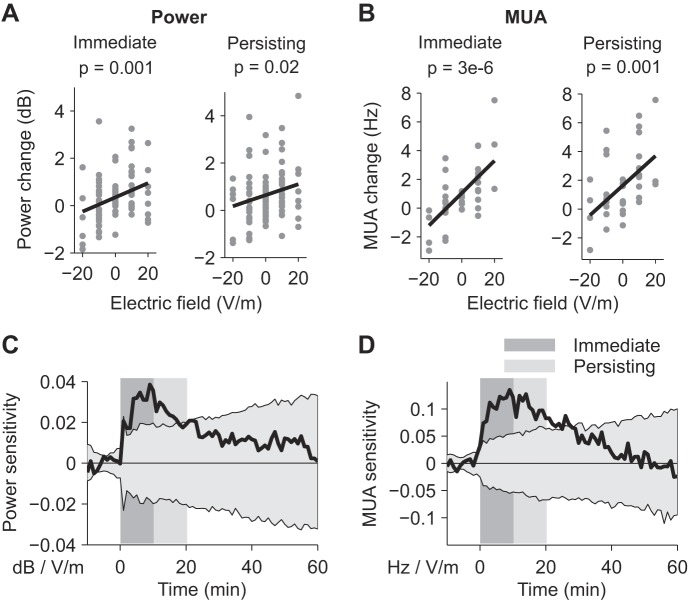
Fig. 2.
Modulation of gamma power and MUA by weak electrical stimulation. A: gamma-power changes for each slice during (left: immediate) and after (right: persisting) the application of electrical stimulation (n = 87). Black line represents a linear fit. B: MUA changes for each slice during (left: immediate) and after (right: persisting) the application of electrical stimulation (n = 39). C: sensitivity of gamma power to the applied field as a function of time (black curve). D: sensitivity of MUA to the applied field as a function of time (black curve). The dark gray rectangles indicate the stimulation period, and the light gray rectangles indicate the interval considered for persisting effects. Gray shading represents 5 and 95% confidence interval.

