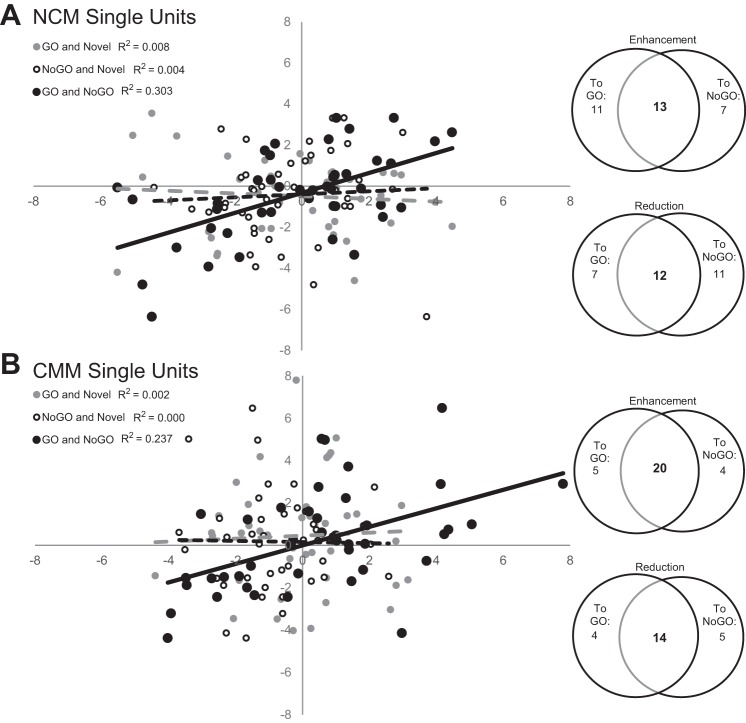
Fig. 12.
A single-unit's d′ values for GO songs are correlated to that unit's d′ values to NoGO stimuli, but not to d′ values for novel songs. A and B: Venn diagrams show the number of NCM and CMM units that show enhanced or reduced responses to both GO and NoGO (relative to novel), compared with the number of units that respond differently to GO and NoGO stimuli. Units that show a decrease in responsiveness to positively reinforced GO stimuli commonly show an increase in responsiveness to negatively reinforced NoGO stimuli, while those units which show reduced activity in response to GO also show reduced responses to NoGO (black data points) in both NCM (r = 0.5507, P < 0.001; A) and CMM (r = 0.4873, P < 0.001; B). Responses to novel stimuli are not correlated to responses to GO (gray) or NoGO (white) stimuli, in NCM or CMM. B: although the population acts as a heterogeneous mix of decreases and increases in neural activity in response to the playback of learned songs, a single unit shows the same direction of effect for GO and NoGO stimuli more often than would be predicted by chance (χ2 = 16.26, N = 43, P < 0.01).

