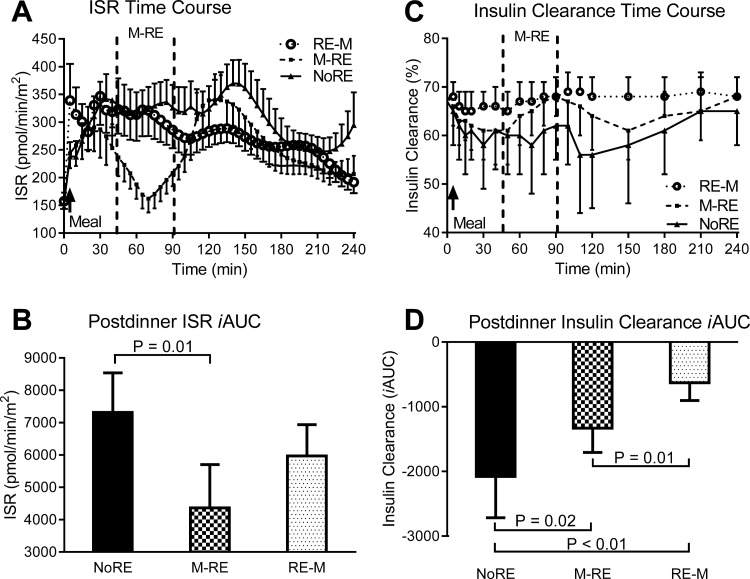
Fig. 3.
Insulin secretion or clearance responses to the dinner meal with pre- or postdinner resistance exercise or no exercise. A and C: insulin secretion response (ISR) and insulin clearance time course, respectively. In the time course figures, the space in between the vertical dashed lines represents the time frame when resistance exercise was performed during the indicated trial. B and D: postmeal ISR and insulin clearance iAUC, respectively. Values are means ± SE; n = 13 subjects.

