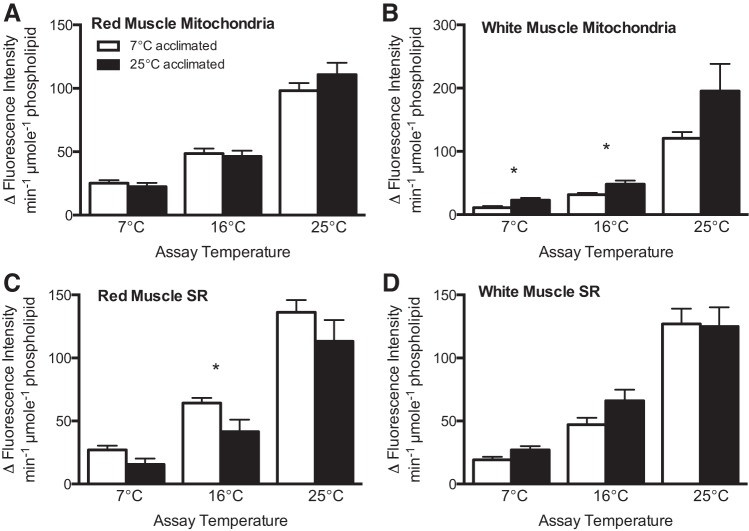
Fig. 1.
Rate of lipid peroxidation (LPO) normalized to phospholipid content in mitochondria (A and B) and sarcoplasmic reticulum (SR; C and D) of red (oxidative; A and C) and white (glycolytic; B and D) muscle from cold (7°C) and warm (25°C) temperature-acclimated striped bass Morone saxatilis. LPO was induced at all assay temperatures (7, 16, and 25°C), with hydroxyl radicals produced by Fenton chemistry. *Significant differences between temperature groups at a given assay temperature (P < 0.05). Data are presented as absolute value of the mean ± SE; n = 7–8.

