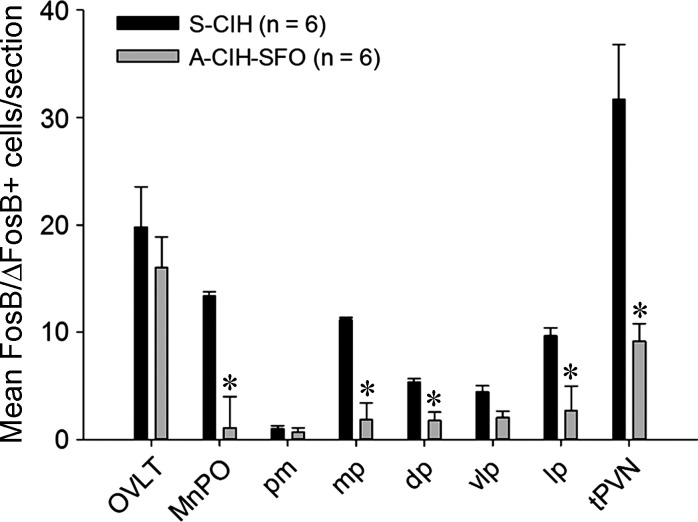
Fig. 11.
Bar graph showing average numbers of FosB/ΔFosB-positive cells per section from OVLT, MnPO, subregions of PVN, and total PVN (tPVN) from rats injected with AT1aR shRNA (A-CIH-SFO; n = 6) or SCM shRNA (S-CIH; n = 6) after 7 days of CIH. *P < 0.05. pm, posterior magnocellular; mp, medial parvocellular; dp, dorsal cap; vlp, ventrolateral parvocellular; lp, lateral parvocellular neurons.

