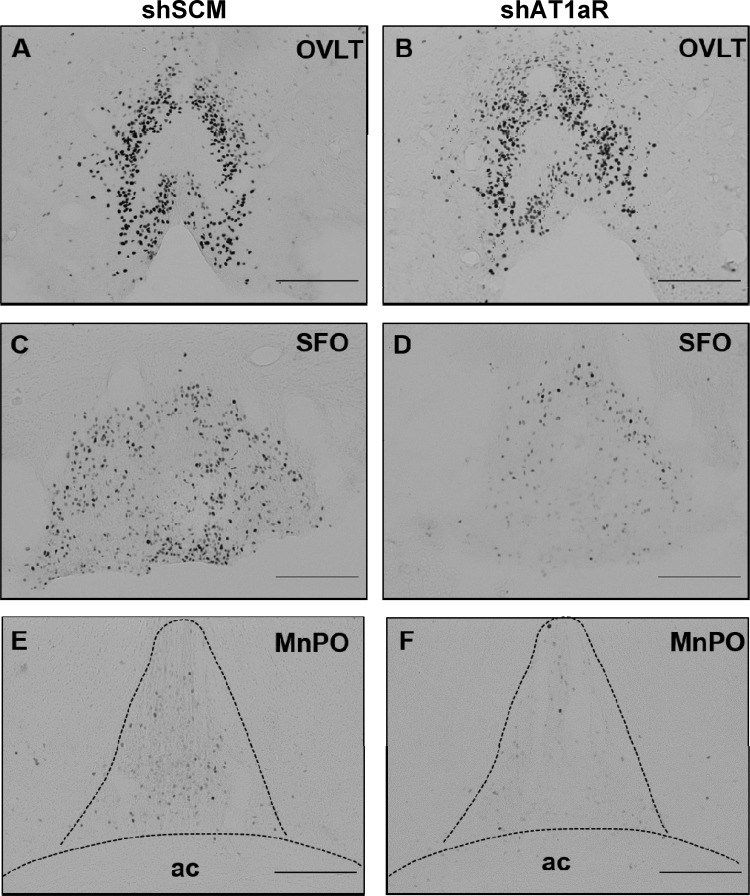
Fig. 4.
c-Fos expression in AV3V nuclei 2 h after sc ANG II administration. Representative photomicrographs showing c-Fos staining in the organum vasculosum of the lamina terminalis (OVLT) (A and B), SFO (C and D), and median preoptic nucleus (MnPO) (E and F) in rats that received AT1aR shRNA in SFO (shAT1aR; right column) or SCM shRNA (shSCM; left column) in SFO. ac, anterior commissure. Scale bar is 200 μm for each image.

