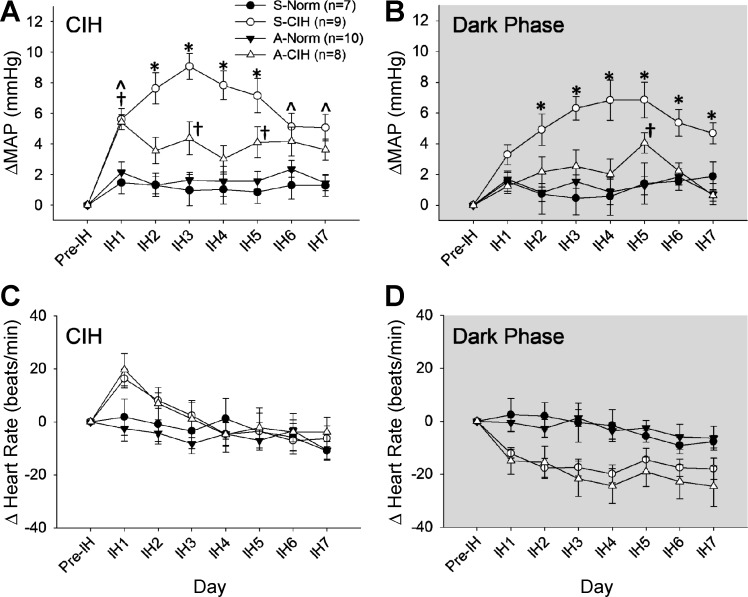
Fig. 7.
Effects of AT1aR knockdown in the SFO on MAP and HR. The changes from baseline (Pre-IH) are shown in MAP during CIH (A) and dark phase (room air breathing; B) and in HR during CIH (C) and dark phase (room air breathing; D). Data are expressed as means ± SE and analyzed using two-way repeated-measures ANOVA followed by Student-Neuman-Keuls test. IH1–IH7, intermittent hypoxia days 1–7. S-Norm, shSCM + normoxia; S-CIH, shSCM + CIH; A-Norm, shAT1aR + normoxia; A-CIH, shAT1aR + CIH. All symbols indicate P < 0.05: *S-CIH vs. all other groups; †A-CIH vs. A-Norm and S-Norm; Ŝ-CIH vs. A-Norm and S-Norm.

