Fig. 4.
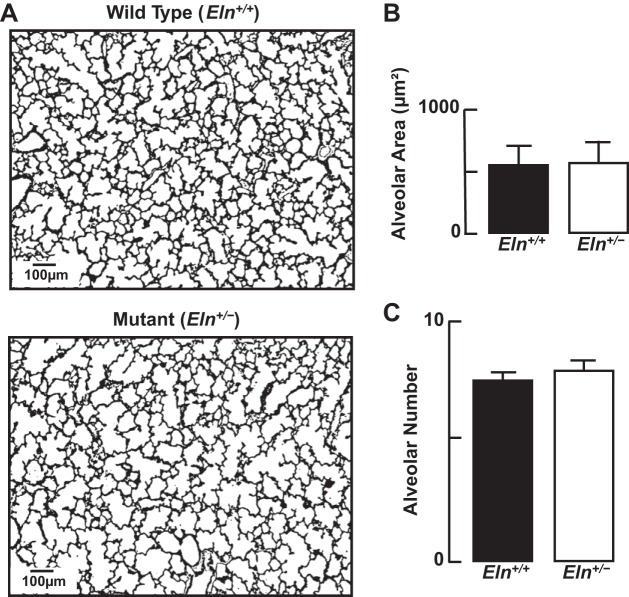
A: representative lung tissue sections (×100; scale bar = 100 μm) showing similar alveolar structure in Eln+/+ and Eln+/− neonatal mice. B: summary data (mean and SD) for alveolar area, assessed by quantitative image analysis of lung tissue sections from Eln+/+ and Eln+/− pups, showing no difference in alveolar size. C: summary data (means and SD) for radial alveolar counts, reflecting similar numbers of alveoli in lungs of Eln+/+ and Eln+/− mice; n = 5/group.

