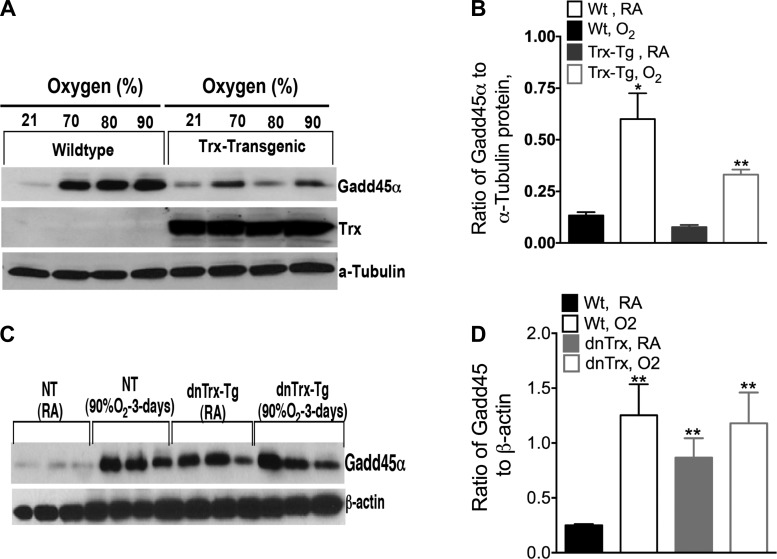
Fig. 8.
Gadd45α expression increases in lungs of dnTrx-Tg mice in normoxia and decreases in lungs of Trx-Tg mice exposed to hyperoxia. A: Western analysis of Gadd45α in WT or Trx-Tg mice exposed to 70, 80, or 90% oxygen for 72 h. B: Western analysis of Gadd45α in mice exposed normoxia or to 90% O2 for 72 h; graph presented shows ratio of Gadd45α to α-tubulin. C: Western analysis of Gadd45α in lung tissue of WT or dnTrx-Tg mice. D: densitometry of C. **Significantly higher than WT mice exposed to 21% oxygen (ANOVA, Tukey's test, P = 0.0001).

