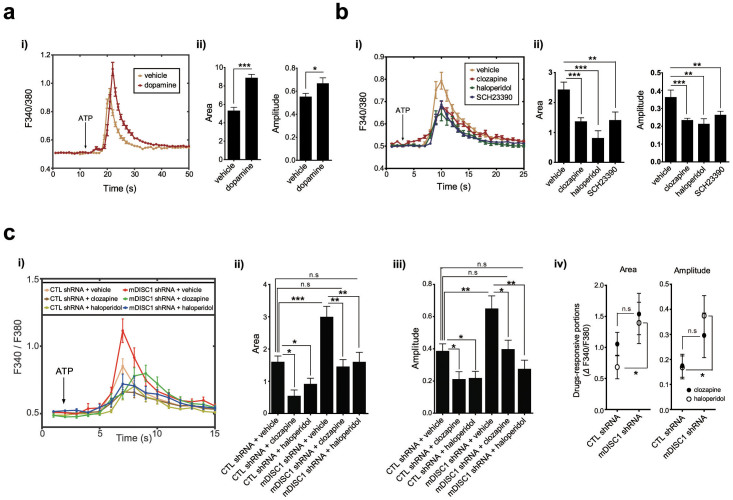
Figure 5. Reversed abnormal ER calcium dynamics with antipsychotic treatment in mDISC1 knockdown hippocampal neurons.
(a) Increased calcium response upon dopamine treatment. ER calcium response curves to 10 mM ATP in hippocampal neurons treated with 10 μM dopamine (i). Average area and amplitude of response curve were analyzed (ii) (n = 66 for vehicle, 59 for dopamine). (b) Decreased calcium response to ATP upon treatment with antipsychotic drugs (clozapine and haloperidol) or a specific antagonist for dopamine D1 receptor, SCH23390. ER calcium response curves to ATP (30 mM) in hippocampal neurons treated with clozapine (1 μM), haloperidol (0.1 μM) or SCH23390 (10 μM) (i). Average area and amplitude of response curve were analyzed (ii) (n = 42 for vehicle, 59 for clozapine, 37 for haloperidol and 50 for SCH23390). (c) Reversal of the exaggerated ER calcium dynamics caused upon mDISC1 knockdown in hippocampal neurons treated with 1 μM clozapine or 0.1 μM haloperidol. Live ER calcium response graph under 30 mM ATP stimulation (i), statistically analyzed average area (ii), amplitudes (iii) and drug-responsive portions (iv) of the graph (n = 31 for control shRNA+vehicle, 11 for control shRNA+clozapine, 22 for control shRNA+haloperidol, 29 for mDISC1 shRNA+vehicle, 14 for mDISC1 shRNA+clozapine, 17 for mDISC1 shRNA+haloperidol). Error bars represent means ± SEM, *; P < 0.05, **; P < 0.01, ***; P < 0.001 (two-tailed t-test).

