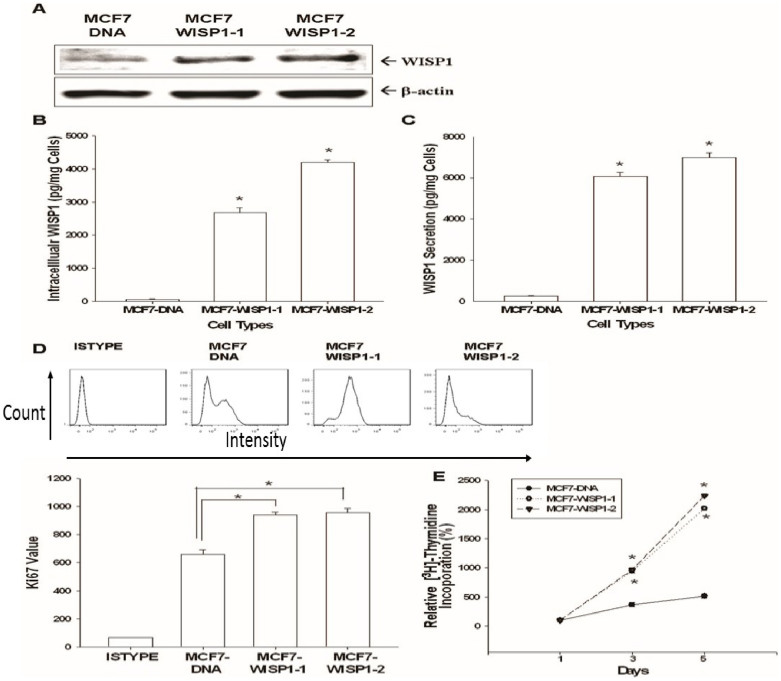
Figure 2. Effect of ectopic WISP1 overexpression on cell proliferation in MCF-7 cells.
(A) Western blot depicting WISP1 expression in MCF7-DNA, MCF7-WISP1-1, and MCF7-WISP1-2 cells. The WISP1 levels of intracellular components (B) and condition media (C) of cells were measured by ELISA. Data are presented as the mean ± SE (n = 6). The effect of ectopic WISP1 expression on MCF-7 cell proliferation was determined by Ki67 expression measured by flow cytometry (D). ISYTYPE represents the negative control group. Data are presented as the mean ± SD (n = 3). 3H-thymidine incorporation assays (E) were also applied to measure cell proliferation. Data are presented as the mean percentage ± SE (n = 3–6) in relation to mock-transfected (MCF7-DNA) cells. (*P < 0.01).

