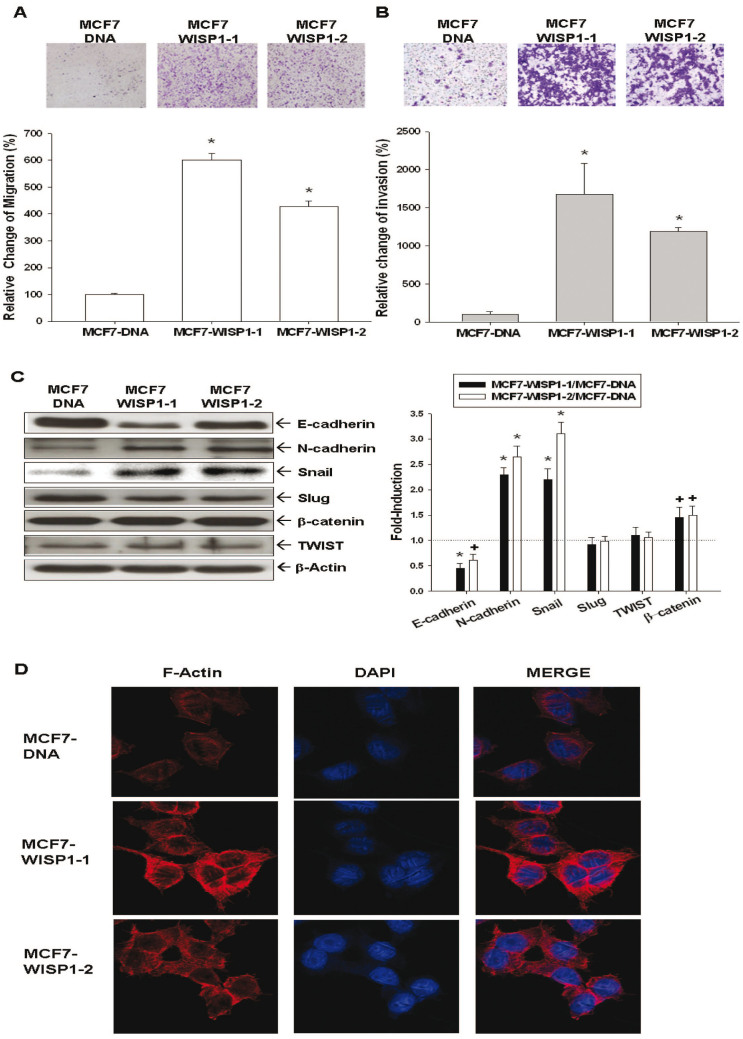
Figure 4. Effect of ectopic overexpression of WISP1 on cell migration, cell invasion, epithelial-mesenchymal transition markers, and F-actin polarization of MCF-7 cells.
The cell migration (A) and invasion (B) of MCF7-DNA, MCF7-WISP1-1, and MCF7-WISP1-2 cells was determined by trans-well filter without and with Matrigel-coated membranes. The migrating or invading cells were digitally photographed and then counted under the microscope. Experiments were performed in triplicate and repeated at least three times, and the data of quantitative analysis were expressed as average cell counts/9 fields ± SE (*P < 0.01). (C) Gene expression of epithelial-mesenchymal transition markers in MCF7-DNA, MCF7-WISP1-1, and MCF7-WISP1-2 cells was determined by western blot assays (Cropped). The fold-induction data are expressed as the intensity of the protein bands produced by the target gene/β-actin (± SE; n = 3) relative to that of the MCF7-DNA cells (*P < 0.01; +P < 0.05). (D) Immunofluorescence staining of F-actin (red) expression and distribution of MCF7-DNA, MCF7-WISP1-1, and MCF7-WISP1-2 cells. DAPI (blue) was applied for nuclear staining.

