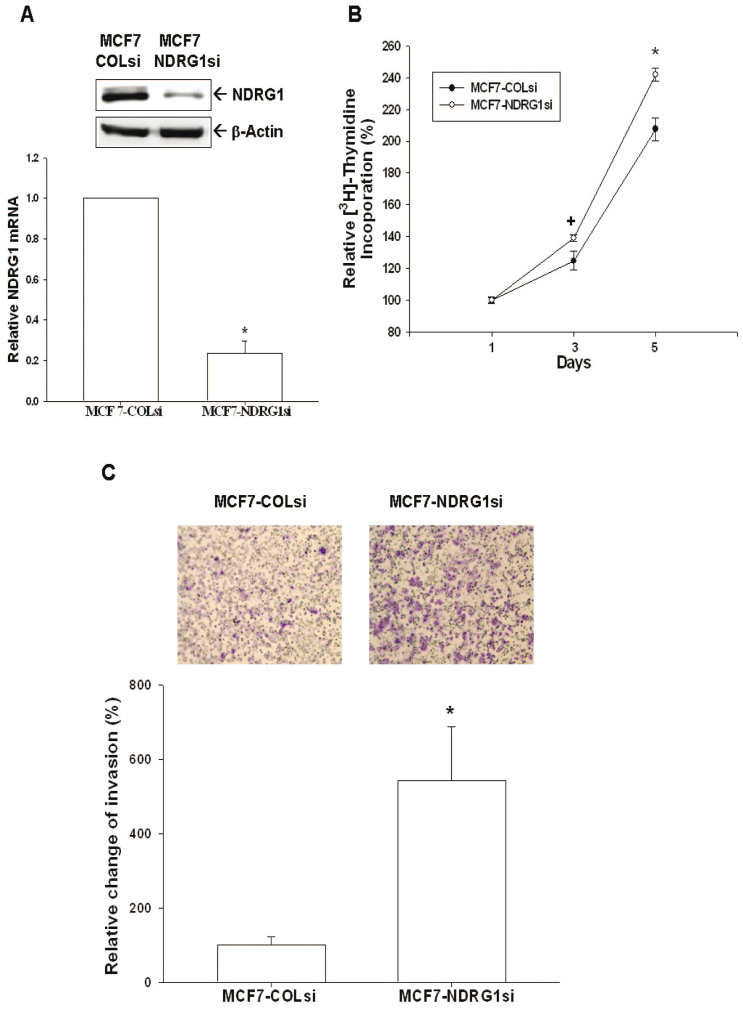
Figure 6. Knockdown NDRG1 enhances cell proliferation and invasion of MCF-7 cells.
(A) The expression of NDRG1 in NDRG1-knockdown MCF-7 (MCF7-NDRG1si) cells and mock-knockdown MCF-7 (MCF7-COLsi) cells were determined by immunoblotting (top) and RT-qPCR (bottom). Data are expressed as mean ± SE (n = 3) and the NDRG1 level of MCF-COLsi cells is set as 1(*P < 0.01). (B) Cell proliferation of MCF7-COLsi (•) and MCF7-NDRG1si (○) cells was determined by the3H-thymidine incorporation assay. Each point on the curve represents the mean percentage ± SE (n = 4) in relation to Day 1. (C) The cell invasion ability of MCF7-COLsi and MCF7-NDRG1si cells after 48 hours incubation was measured using the matrigel-invasion assay. Experiments were performed in triplicate and repeated at least three times. Data of quantitative analysis are expressed as average cell counts/9 fields ± SE of MCF7-COLsi and MCF7-NDRG1si cells. (*P < 0.01).

