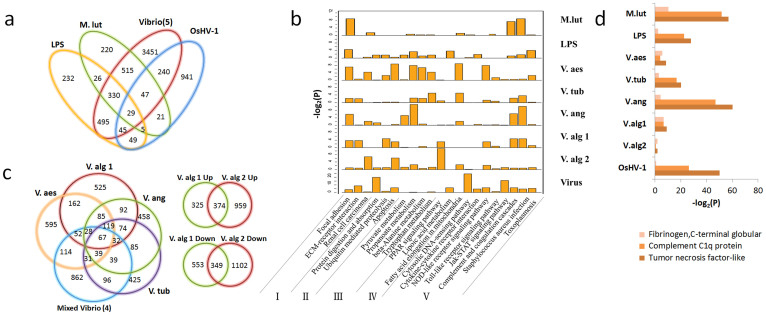
Figure 2. Infection response genes in the Pacific oyster, Crassostrea gigas.
(a), Venn diagrams of differentially expressed genes under the challenge of LPS, Gram positive bacteria M. lut (Micrococcus luteus), Five types of Vibrio (V. anguillarum, V. tubiashii, V. aestuarianus, V. alginolyticus-1, V. alginolyticus-2), and OsHV-1 (ostreid herpesvirus). (b), Major pathways enriched for the up-regulated genes under seven types of pathogen and LPS challenges. I. Cell adhesion related; II. Cellular protein homeostasis; III. Amino acid metabolism; IV. Lipoic acid metabolism; V. Host immune defense. (c), (Left) Unique and differentially expressed genes infected with four types of Vibrio administered separately and simultaneously; (Right) Unique and differentially expressed genes infected with two strains of V. alginolyticus. (d), The three most enriched domain types of up-regulated transcripts generated by pairwise comparison of seven types of pathogens and LPS challenges vs PBS challenge. Three different colors represent three different enriched domains. The x axis is the – log 2 transformation of the p-value calculated in the enrichment test.

