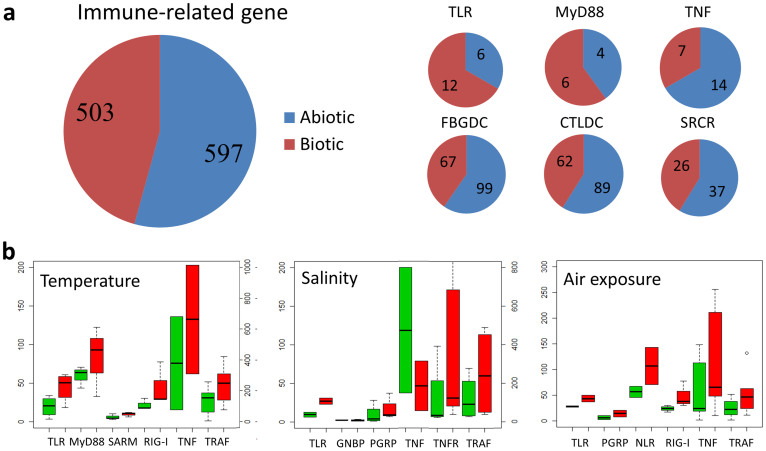
Figure 5. Expression differences of representative immune-related gene families under biotic and abiotic stress.
(a), Comparison of the numbers of differentially expressed genes under abiotic and biotic challenges indicating that a set of immune genes function in abiotic stresses (see Supplementary Table S3 online). (b), Expression patterns of immune-related genes during different abiotic challenges. The boxes indicate the expression levels (RPKM) of representative immune genes under normal (green) and stress (red) conditions.

