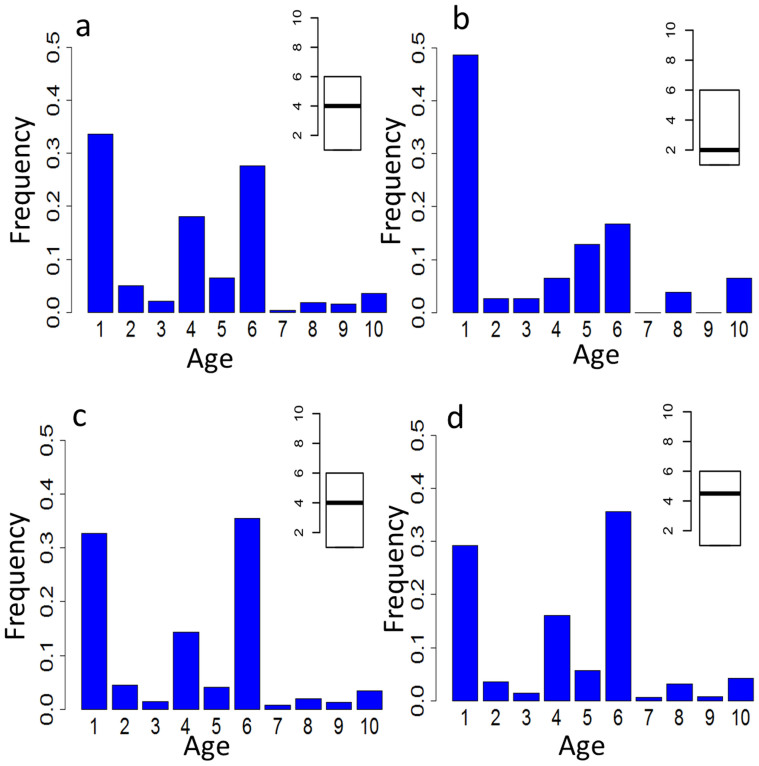
Figure 7. Phylostratigraphic ages of different functional groups of genes.
Phylostratigraphic analyses classify genes into 10 levels, ranging from cellular organisms (age 1) to Bivalvia (age 10)39. The highest phylostratigraphic values corresponding to the youngest genes specific to Bivalvia. Other ages represented as: Eukaryota (2), Opisthokonts (3), Metazoa (4), Eumetazoa (5), Bilateria (6), Protostomia (7), Lophotrochozoa (8) and Mollusca (9). Frequencies of genes with different phylostratigraphic ages, including: (a), all immune-related genes; (b), specifically expressed during early development; (c), responsive to abiotic stress (temperature, salinity and air exposure) and (d), responsive to biotic (bacteria and LPS) challenges. The insert boxplots depict the mean and range of gene ages for the corresponding gene sets.

