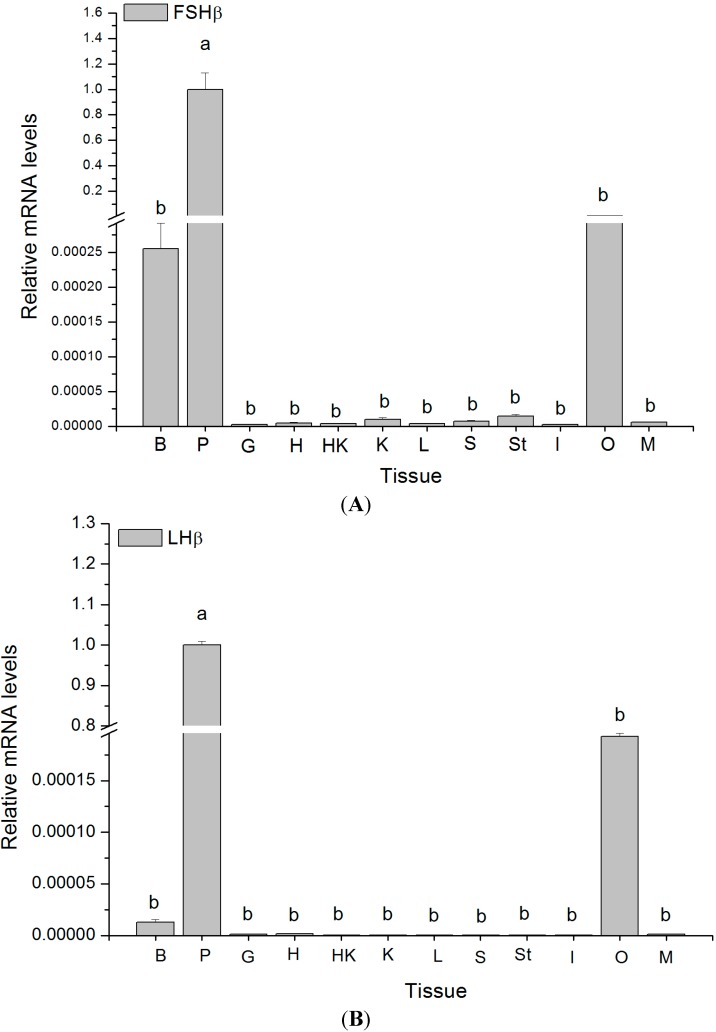
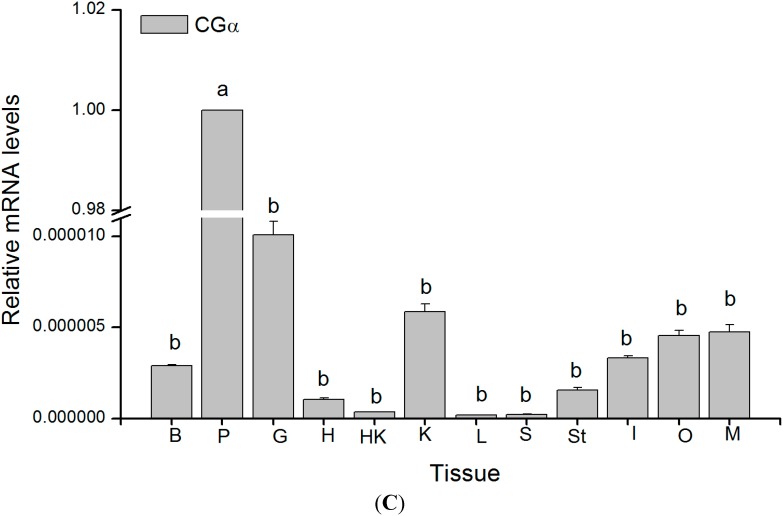
Figure 6.
Relative mRNA expression levels in maturing female C. semilaevis tissues. The abundance of FSHβ (A), LHβ (B) and CGα (C) transcripts, respectively, was determined by qRT-PCR and normalized to 18S (n = 4). Each bar represents the mean ± SE. Tissues marked by the different letters differing significantly from each other (p < 0.05). B: Brain, P: Pituitary, G: Gill, H: Heart, HK: Head kidney, K: Kidney, L: Liver, S: Spleen, St: Stomach, I: Intestine, O: Ovary, M: Muscle.


