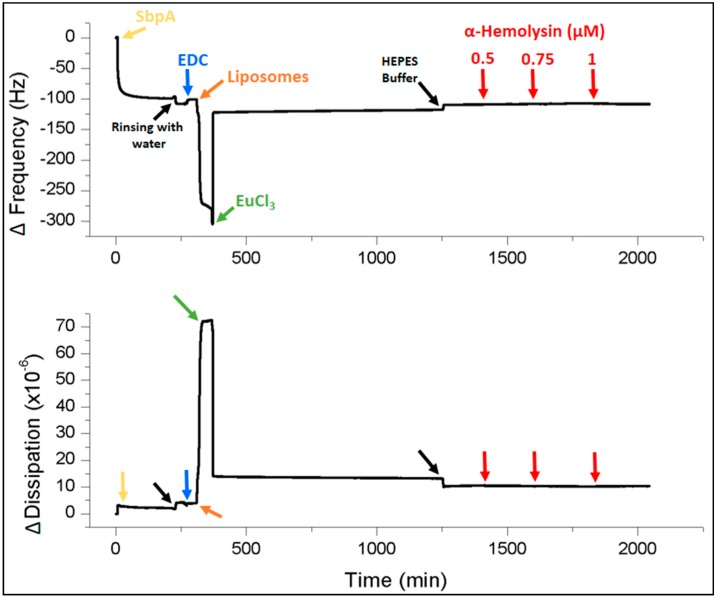
Figure 2.
Representative shift in frequency (bottom) and dissipation (top) versus time during the formation of SsLMs and the subsequent addition of increasing amounts of α-hemolysin at different concentrations (0.5, 0.75 and 1 µM) as indicated in the plots. All shown QCM-D data were recorded at the 7th overtone.

