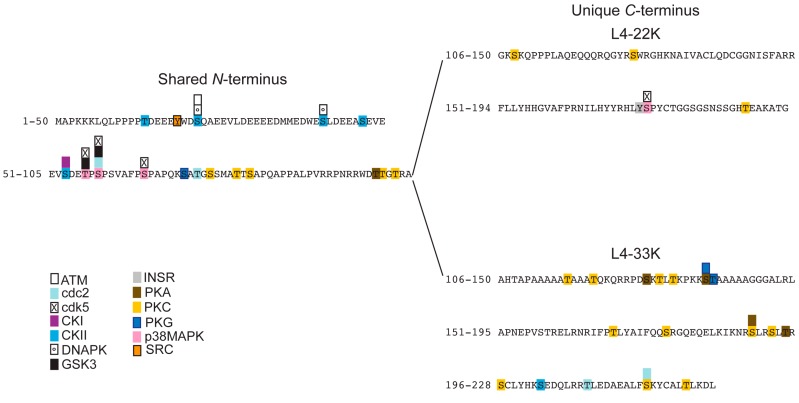
Figure 6.
Predicted phosphorylation sites of Ad5 L4-33K and L4-22K proteins. The shared N-terminal region is shown on the left, and the unique L4-22K and L4-33K C-termini are on the right. The result of the phosphorylation sites prediction performed with NetPhosK 1.0 is graphically shown as boxes for the respective kinases in the corresponding predicted residue, according to the color code in the figure. Amino acids potentially phosphorylated by more kinases are marked by piled boxes, according to the kinases and the respective score (lowest score on top and highest on the protein sequence).

