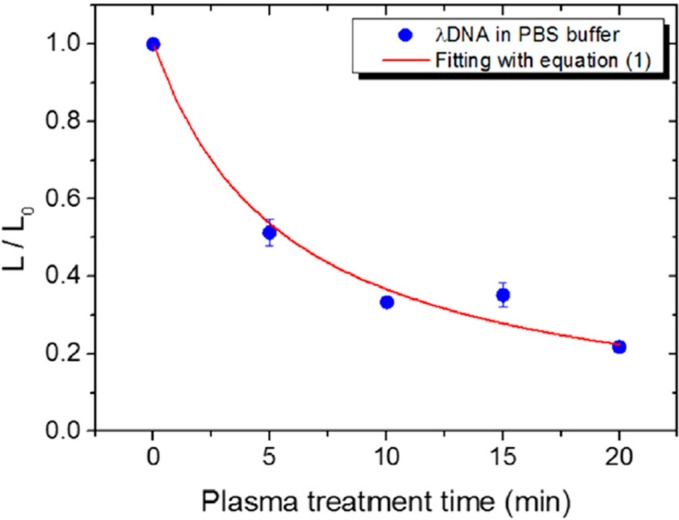
Figure 10.
Representation of the rate of change of DNA molecule average length (where L0 is the DNA length before plasma exposure, and L is the length after the exposure) in PBS solution treated by APP at various exposure times. Adapted from [59] with the permission of Elsevier, Inc., 2014.

