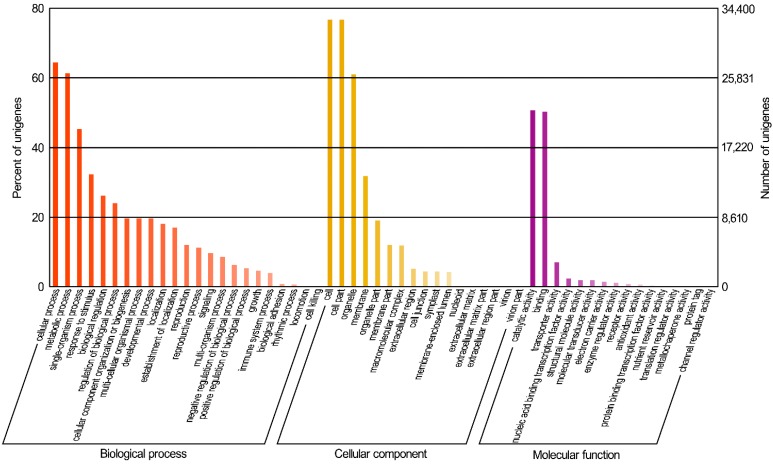
Figure 3.
Histogram presentation of gene ontology (GO) functional classification. The results are summarized in three GO ontologies: biological process, cellular component and molecular function. The right y-axis indicates the number of unigenes in a category and the left y-axis indicates the percentage in the same category.

