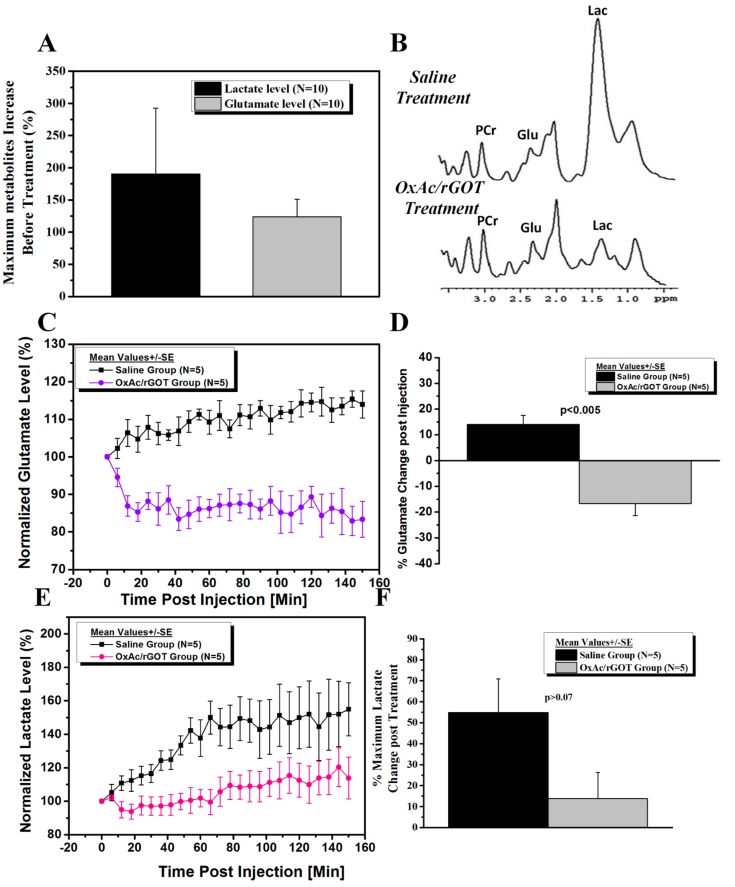
Figure 2.
(A) Post PO exposure before treatment, lactate and glutamate levels increased in comparison with baseline values before the exposure to PO. Data were expressed as mean ± S.E. p < 0.05 for both metabolites as determined by t-test (in comparison with baseline values); (B) Representative in vivo proton MRS spectra in the hippocampus after OxAc/rGOT and saline treatments at the latest MRS time point. Lactate (Lac) is resolved at 1.3 ppm, glutamate (Glu) at 2.2 ppm and phosphocreatine (PCr) at 3.0 ppm; (C) Normalized glutamate levels in the hippocampus after OxAc/rGOT and saline treatments as a function of time. Data were expressed as mean ± S.E. p < 0.005 as determined by t-test; (D) The hippocampus glutamate levels after the OxAc/GOT or saline treatments at the end of the experiment; (E) Normalized lactate levels in the hippocampus after OxAc/rGOT and saline treatments as a function of time; (F) The hippocampus lactate levels after the OxAc/GOT or saline treatments at the end of the experiment. Data were expressed as mean ± S.E. p < 0.04 as determined by t-test.

