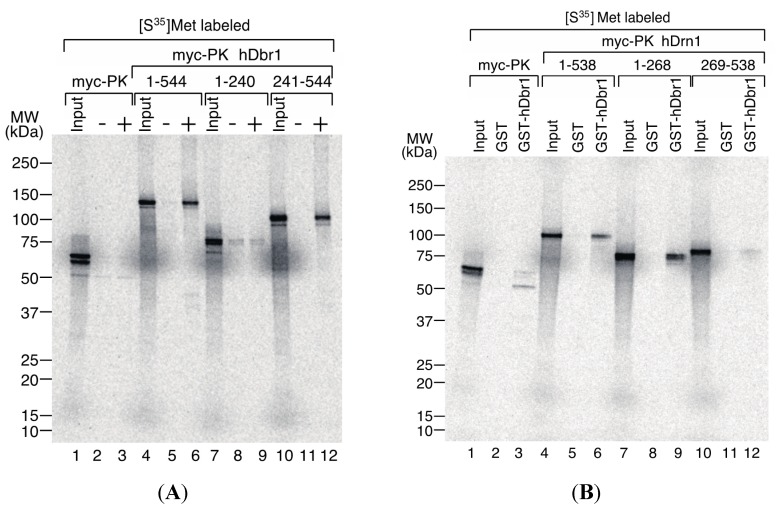
Figure 6.
Determination of the interaction domains of hDbr1 and hDrn1. (A) 2 μg of T7-His-hDrn1 proteins were incubated with in vitro translated myc-PK, myc-PK hDbr1 (aa. 1–544), myc-PK hDbr1 (aa. 1–240) and myc-PK hDbr1 (aa. 241–544). After washing, bound proteins were eluted, separated on 5%–20% gradient SDS-PAGE and visualized by fluorography. Input lanes contain 5% of the total protein used in each binding experiment. The positions of protein molecular mass markers are shown on the left of the panel; and (B) In vitro translated myc-PK, myc-PK hDrn1 (aa. 1–538), myc-PK hDrn1 (aa. 1–268) and myc-PK hDrn1 (aa. 269–538) were incubated with 5 μg of either GST alone or GST-hDbr1. The bound proteins were analyzed and visualized as in (A). Input lanes contain 5% of the total protein used in each binding experiment. The positions of protein molecular mass markers are shown on the left of the panel.

