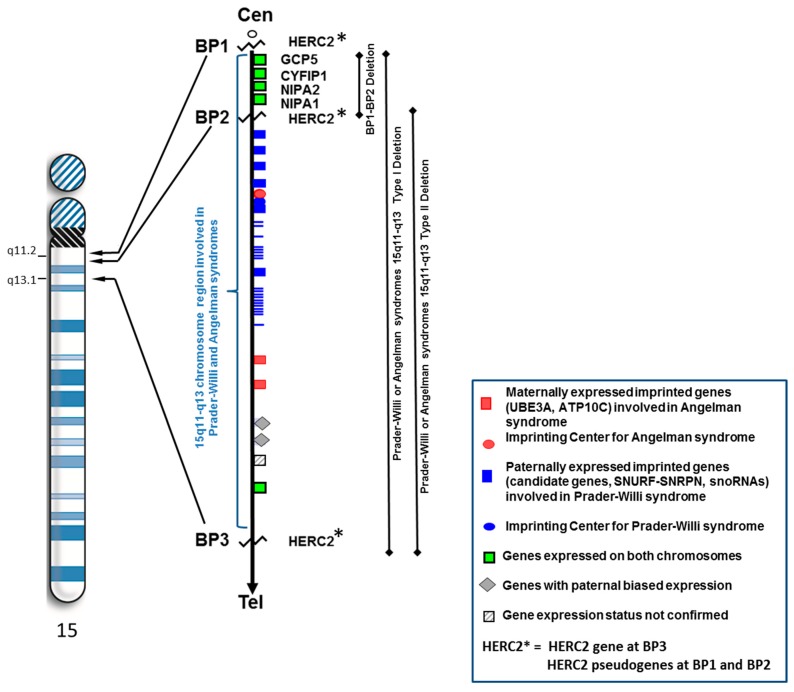
Figure 1.
High resolution ideogram representing chromosome 15 showing location of breakpoints BP1 and BP2 (at 15q11.2 band) and BP3 (at 15q13.1 band) involving HERC2 and position of the non-imprinted genes between BP1 and BP2. The three deletion types involving the 15q11–q13 region (i.e., BP1–BP2, typical type I, typical type II) are represented.

