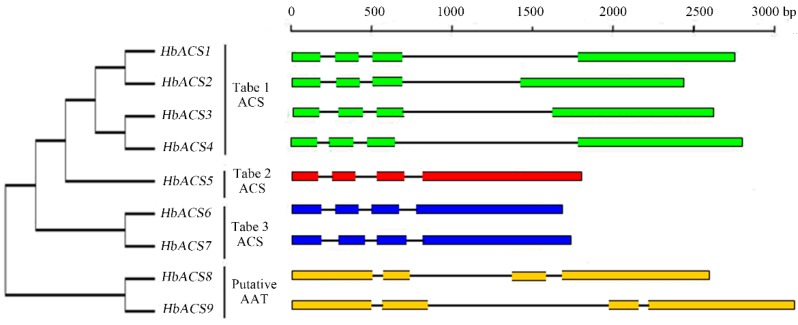
Figure 3.
Neighbor-joining phylogenetic tree and intron-exon structures. The phylogenetic tree (part of the left side) was constructed from HbACSs using the MEGA 6.0 program with the NJ method. Intron and exon structural organization of HbACS genes are described on the right side. Introns and exons are represented by black lines and colored boxes, respectively.

