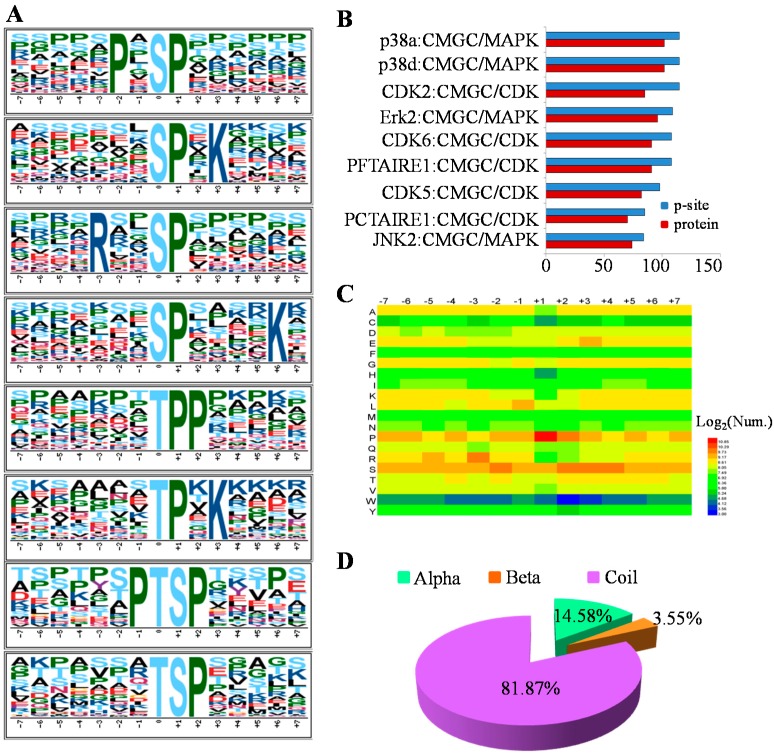
Figure 4.
Analysis of p-sites by sequence motif, Group-based Prediction System (GPS) algorithm with the interaction filter, or in vivo GPS (iGPS), the distribution of amino acid flanking and structural preferences in the MHCC97-H cell line. (A) The sequence motif analysis of p-sites in the MHCC97-H cell line consisting of 14 residues surrounding the targeted site by Motif-X; (B) The top 10 protein kinases with the most p-sites by the prediction of iGPS; (C) The heatmap for the distribution of amino acids flanking p-sites in the MHCC97-H phosphoproteome; (D) The secondary structural distribution for the p-sites.

