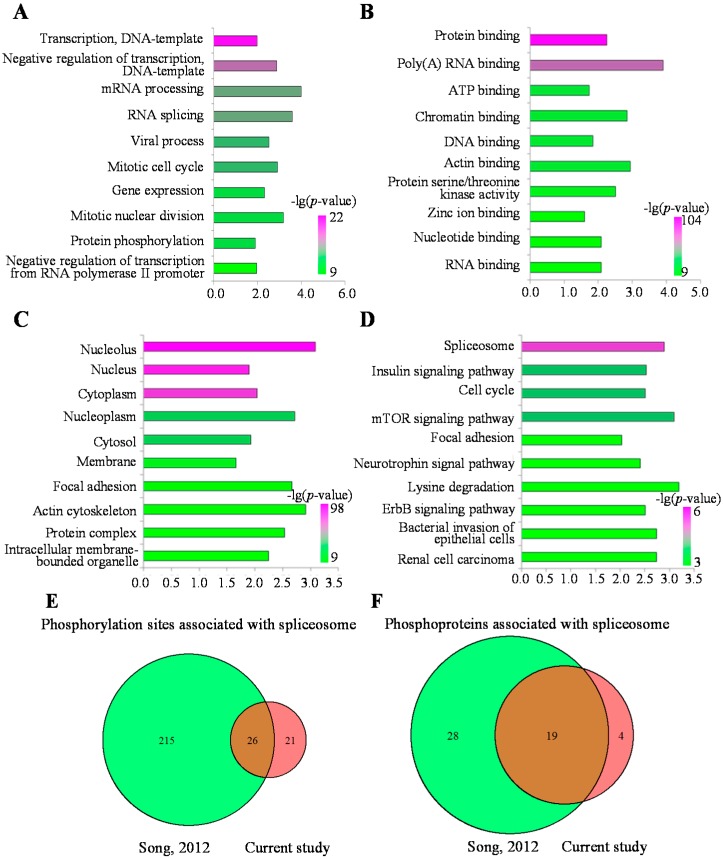
Figure 5.
Gene Ontology (GO) annotation and the Kyoto Encyclopedia of Genes and Genomes (KEGG) pathway (top 10) analysis for phosphoproteins. (A) Biological process of GO annotation (top 10); (B) Molecular function of GO annotation (top 10); (C) Cellular component of GO annotation (top 10); (D) The most over-represented KEGG pathways; (E) Comparison of p-sites associated with the spliceosome between MHCC97-H and the normal liver sample; (F) Comparison of phosphoproteins associated with the spliceosome between MHCC97-H and the normal liver sample.

