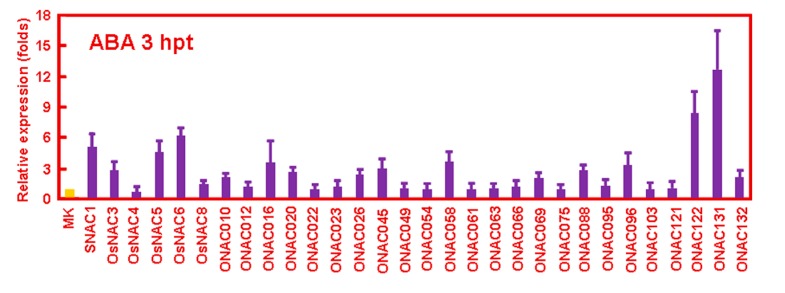
Figure 2.
Differential expressions of 30 selected ONAC genes in response to ABA. Rice seedlings were treated with ABA for 3 h and expression of ONAC genes was analyzed by quantitative RT-PCR. Relative expression for each ONAC gene was calculated by comparison with corresponding control. Error bars represent standard errors of the means from three independent biological replicates.

