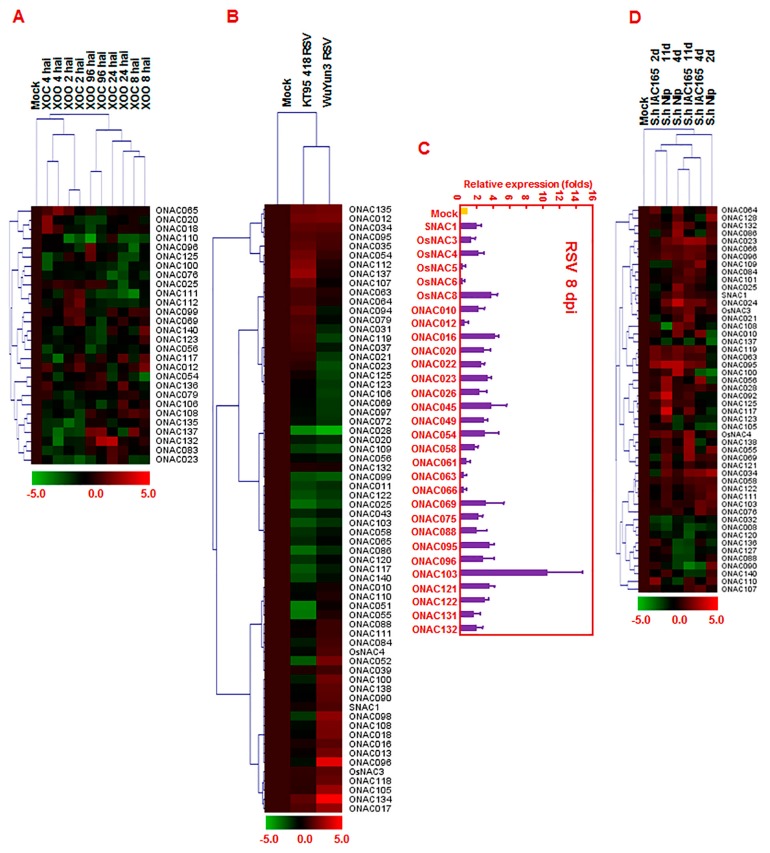
Figure 4.
Differential expressions of ONAC genes in response to Xoo, Xoc and RSV. (A,B) Heat maps of ONAC genes showing differential expression patterns in rice seedlings after Xoo and Xoc infection and RSV infection, respectively. The change values in treated samples vs. corresponding control, shown as (log2(signal intensity in treatment/signal intensity in control) = log2signal intensity in treatment − log2signal intensity in control), were used for Treeview (Supplementary file 2). The color scale of change values is shown at the bottom; (C) Differential expression of 30 selected ONAC genes in rice after RSV infection; (D) Heat Map of ONAC genes showing differential expression patterns after infestation by S. hemonthica. Quantitative RT-PCR analysis was performed and relative expression for each ONAC gene was calculated by comparison with corresponding control. Error bars represent standard errors of the means from three independent biological replicates.

