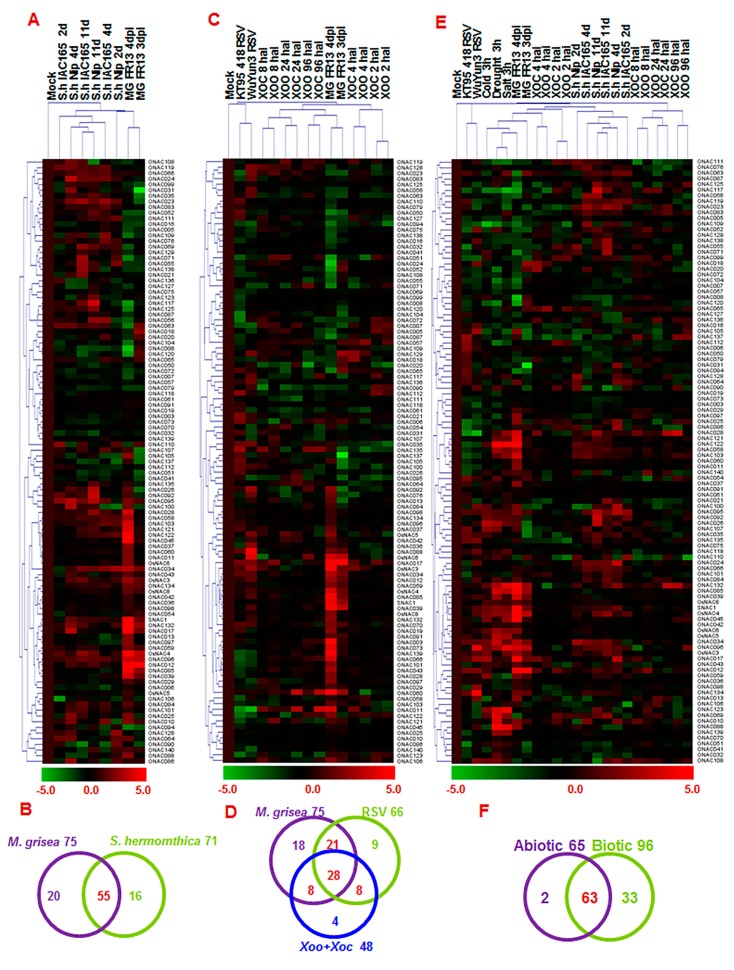
Figure 5.
Overlapping expression of ONAC genes in response to various biotic and abiotic stresses. (A) Heat map of ONAC genes, showing differential expression patterns in response to M. oryzae and S. hermonthica; (B) Venn diagram represents number of ONAC genes expressed commonly or specifically in response to M. oryzae and S. hermonthica (t-test p < 0.01); (C) Heat map of ONAC genes showing differential expression patterns in response to M. oryzae, RSV, Xoo, and Xoc; (D) Venn diagram represents number of ONAC genes expressed commonly or specifically in response to M. oryzae, RSV, Xoo, and Xoc (t-test p < 0.01); (E) Heat map of ONAC genes showing differential expression patterns under abiotic (salt, drought, and cold) and biotic (infection by M. oryzae, Xoo, Xoc, or RSV, or infestation by S. hermonthica) stress; (F) Venn diagram represents number of ONAC genes expressed commonly or specifically in response to biotic and abiotic stresses (t-test p < 0.01). The change values (A,C,E) in treated samples vs. corresponding control, shown as (log2(signal intensity in treatment/signal intensity in control) = log2signal intensity in treatment − log2signal intensity in control), and the relative expression folds were calculated by 2change values. Both of them were used for Treeview (Supplementary file 2). The color scales of change values and relative expression folds were shown at the bottom.

