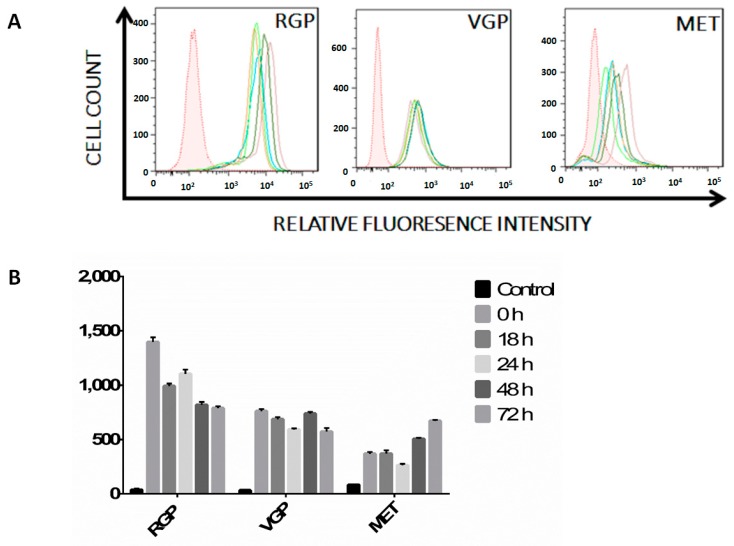
Figure 3.
(A) Flow cytometric analysis of IFN-γ receptor expression. Cells were treated with IFN-γ for 0 h (blue), 18 h (orange), 24 h (lime green), 48 h (dark green) or 72 h (mauve). Unstained cells (shaded histogram) are shown as a control. Live cells were stained with PE-conjugated antibody against CD119 (IFN-γ R1), were fixed in 2% paraformaldehyde and were then analyzed on a Fortessa flow cytometer. RGP cells express high levels of the IFN-γ receptor as compared to the unstained control. VGP cells express low levels of the IFN-γ receptor with no change throughout 72 h of stimulation. MET cells express varying amounts of IFN-γ receptor throughout 72 h of stimulation. Changes in receptor expression between time points is not statistically significant (p > 0.05). The data shown are representative of a minimum of three experimental replicates; (B) Mean fluorescence intensity of histograms seen in (A) normalized to the isotype control. The data shown are the average of three experimental replicates.

