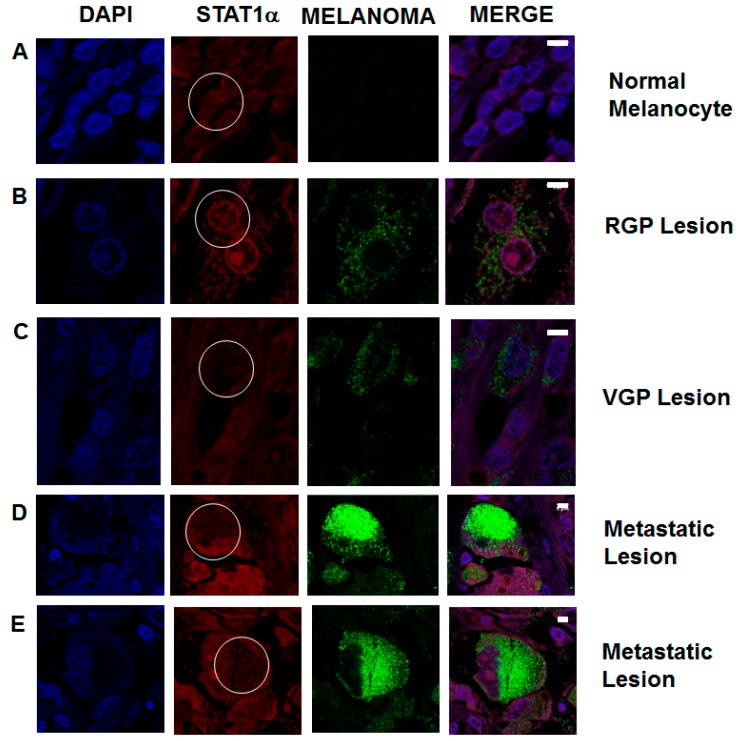
Figure 7.
Immunofluorescence staining of STAT1 expression in non-metastatic and metastatic melanocytic lesions from patient samples. Tissue microarrays of patient samples were de-waxed, rehydrated and stained for the expression of STAT1 (red) and metastatic melanoma biomarkers (green). Cell nuclei are stained with DAPI (blue). Regions of interest are circled in white on the STAT1 panels. (A) Normal melanocytes show constitutive STAT1 expression; (B) Primary tumors characterized as RGP show a slight decrease in STAT1 expression; (C) VGP melanoma lesions show an increase in melanoma biomarkers, as well as a decrease in STAT1; (D,E) Metastatic melanoma lesions show a marked increase in metastatic melanoma biomarkers, which correlates with a decrease in STAT1. These data show a correlation between biomarkers of metastasis and the decrease in STAT1 expression in patient tumor samples. Data are representative of images taken from approximately 150 patient samples. Scale bars represent 5 µm.

