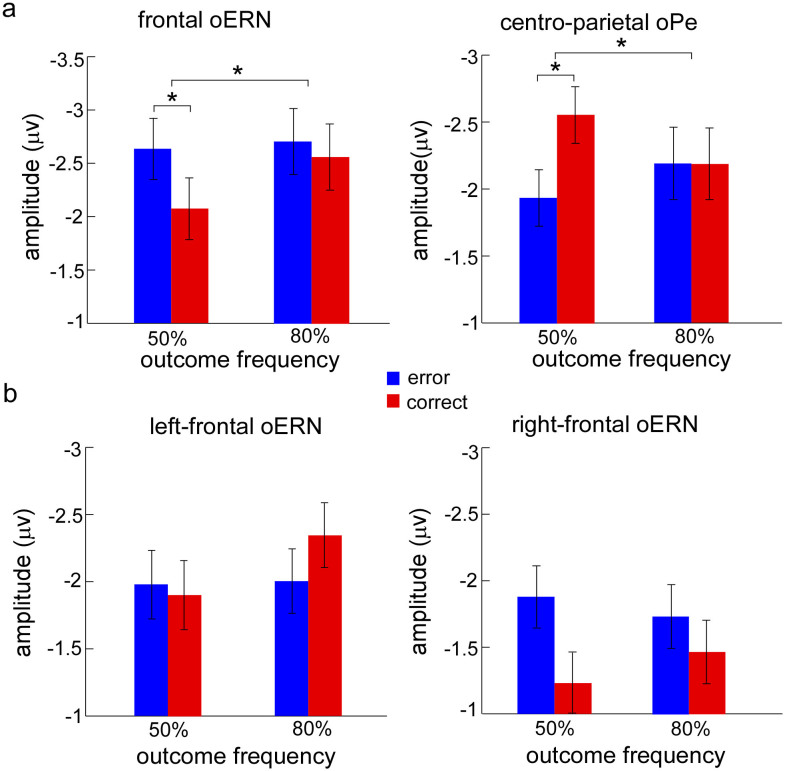
Figure 4. The mean amplitude in the observation task for observation errors and observation correct responses in the 50% and 80% error rate conditions, respectively.
(a) The neural activity evoked by observation errors and by observation correct responses in the 50% and 80% error rate conditions for frontal oERN and centro-parietal oPe. (b) The hemisphere effect of oERN between left-frontal and right-frontal regions. error (blue bars) represents the neural activity evoked by observation errors, and correct (red bars) represents the neural activity induced by observation correct responses. Error bars denote standard error. Significant differences are indicated by asterisks (* p < 0.05).

