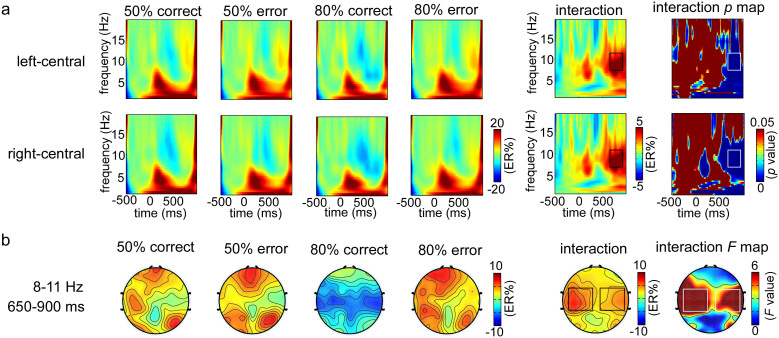
Figure 5. The time-frequency resluts in the observation task.
(a) The grand-average time-frequency representations (expressed as ER%) for each condition (50% correct, 50% error, 80% correct, and 80% error) and the interaction between outcome valence and outcome frequency within the defined S-ROIs, including left-central region [(FC1 + FC3 + FC5 + C1 + C3 + C5 + CP1 + CP3 + CP5)/9] and right-central region [(FC2 + FC4 + FC6 + C2 + C4 + C6 + CP2 + CP4 + CP6)/9]. The corresponding interaction p map is the reslut of bootstrapping statistical analysis at the significance level of p < 0.05 (FDR corrected), which is used to define the TF-ROI in each S-ROI. Note that a pre-response interval from −450 to −50 ms is used as the baseline. The time–frequency pixels displaying a significant difference from the baseline are colored in blue. The significant task-related TF-ROIs are outlined in the rectangles. Each row corresponds to one S-ROI corresponding to the largest modulation of the task-related effects. X-axis, time (ms); Y-axis, frequency (Hz). (b) The scalp topographies of ERSP magnitudes for each condition and the two-way interaction within the defined TF-ROI (alpha band). The corresponding interaction F topography is the reslut of two-way repeated-measures ANOVA, which is used to define the significant S-ROI in the corresponding TF-ROI. 50% correct represents the neural activity of observation correct responses in the 50% error rate condition, 50% error represents the neural activity of observation errors in the 50% error rate condition, 80% correct represents the neural activity of observation correct responses in the 80% error rate condition, and 80% error represents the neural activity of observation errors in the 80% error rate condition.

