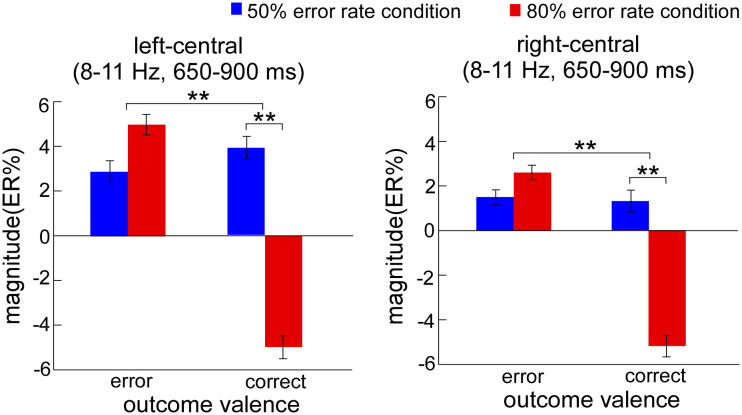
Figure 6. The mean ERSP magnitudes (expressed as ER%) for the alpha band (8–11 Hz, 650–900 ms) in the observation task.
ERSP magnitudes on observation correct responses were significantly smaller in the 80% than in the 50% error rate condition for left-central and right-central regions. The blue bars represent the neural power induced by observation responses in the 50% error rate condition. The red bars represent the neural power induced by observation error responses in the 80% error rate condition. ms means milliseconds. Error bars denote standard error. Significant differences are indicated by asterisks (** p < 0.01).

