
Figure 1.
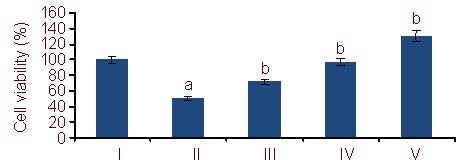
Viability of PC12 cells (MTT assay). The data are expressed as mean ± SD. The experiments were repeated at least three times (n = 6).
aP < 0.05, vs. control group; bP < 0.05, vs. Aβ25-35 group (one-way analysis of variance and least significant difference method). MTT: methylthiazolyldiphenyl- tetrazolium bromide; Aβ: amyloid β protein; I–V: control, Aβ25-35, 5, 10, 25 μM Schisandrin B groups, respectively.