Figure 2.

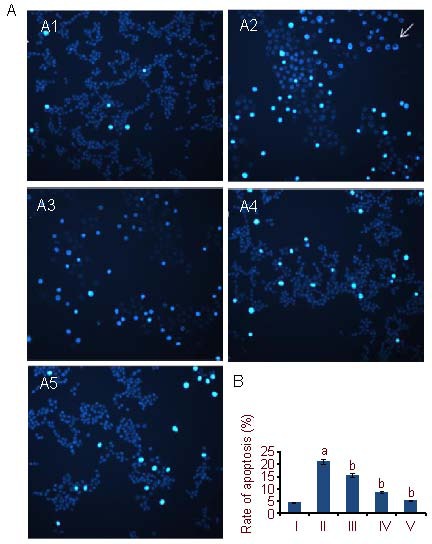
PC12 cell apoptosis (Hoechst 33342 staining).
(A) PC12 cell apoptosis under fluorescence microscope (nuclear staining, × 400).
(A1) Control group: nuclei have non-erratic borders with even, low intensity blue fluorescence.
(A2) Aβ25-35 group: chromatin exhibited agglutination and marginalization with pyknotic brillant blue fluorescence of the nucleus; some nuclei exhibited a fluorescence ring (arrow).
(A3–A5) Aβ25-35 + Schisandrin B groups (5 μM, 10 μM, 25 μM): The number of cells with brillant blue fluorescent nuclei is decreased in a dose-dependent manner, cells are even and intact compared with the Aβ25-35 group.
(B) Quantification of cell apoptosis. Rate of apoptosis (%) = the number of apoptotic cells/the number of all counted cells × 100%. Aβ: Amyloid β protein; I-V: control, Aβ25-35, 5, 10, 25 μM Schisandrin B groups, respectively.
The data are expressed as mean ± SD. The experiments were repeated at least three times (n = 3). aP < 0.05, vs. control group. bP < 0.05, vs. Aβ25-35 group (one-way analysis of variance and least significant difference method).
