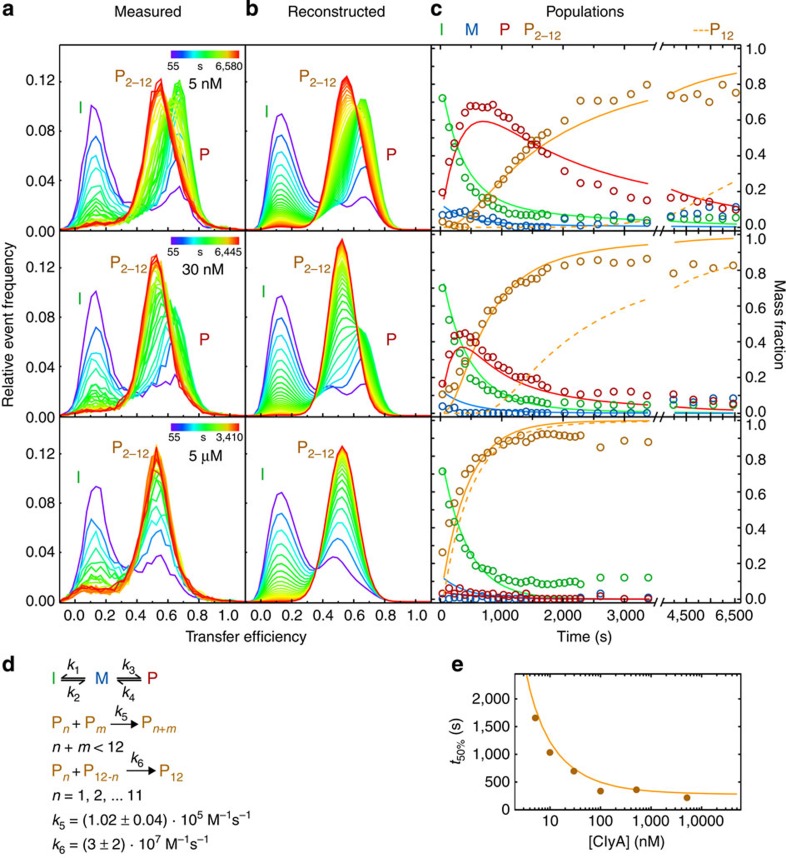
Figure 4. Kinetics of ClyA pore formation at different total ClyA concentrations followed by single-molecule FRET.
(a) Measured transfer efficiency histogram time series after manual mixing. Each coloured line represents one histogram (area normalized to 1) at a certain time after starting the reaction (colour code shown in the upper right of each panel). Most of the monomer depopulates during the dead time of the experiment, and thus no pronounced monomer peak is observed. (b) Reconstructed histograms according to the pore formation model shown in d. (c) Population time courses of the different species according to two different types of analysis of the histogram time series. Circles: populations from individual fits of the histograms with peak amplitudes as free parameters, and peak positions and widths as shared (global) fit parameters. Solid lines: populations from a global fit of all 217 histograms from all ClyA concentrations according to the non-sequential assembly model with two rate coefficients (see d). As the different oligomers cannot be discriminated in the histograms, the population P2–12 represents the total population of all protomers in oligomers. The dashed line shows the population of complete pores as predicted by the model (see Supplementary Fig. 9c for the other oligomers). See Methods section for details on the fitting procedure. Data for ClyA at 0.1, 10, 100 and 500 nM were also included in the global fit (Supplementary Fig. 8). I, intermediate; P2–12, oligomeric species; P, protomer; M, monomer. (d) Schematic of the non-sequential assembly model of pore formation. Protomer formation occurs according to an off-pathway model (Fig. 2); oligomerization of protomers and assembly with other oligomers all occur with the same rate coefficient (k5) if they lead to incomplete pores; formation of complete pores occurs with a different rate coefficient (k6). See Methods for details on error calculation. (e) Dependence of pore formation kinetics on ClyA concentration. Plotted is t50% (time when 50% of the ClyA molecules are in an oligomeric state), versus the total concentration of ClyA subunits, according to the populations from the free fit (filled circles) and as predicted by the pore assembly model (d; solid line).

