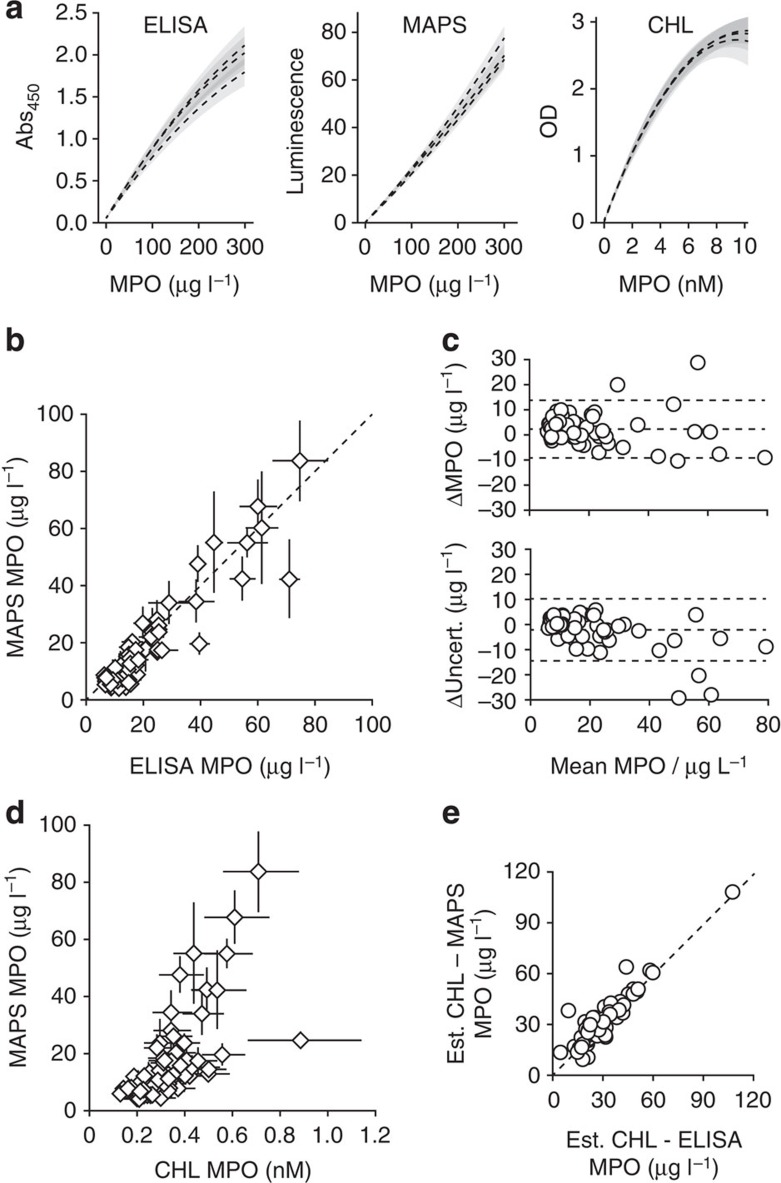
Figure 7. MAPS and ELISA with clinical plasma samples.
(a) Three calibration curves with triplicate prediction bands. The mean limit of detection for MAPS was significantly lower than for ELISA, 6.0 (5.3–6.6) and 7.4 (6.7–8.1) μg l−1, respectively (generalized linear regression P=0.002). (b) Regressed plasma MPO from 72 clinical plasma samples. Error bars show combined uncertainty from calibration curves and inter-replicate variance by WLS regression. The assays are not significantly different from perfect agreement (dashed line) by either unweighted (P=0.46) or uncertainty-weighted (P=0.61) matched pair linear regression. (c) Discrepancy (ELISA–MAPS) of both MPO result and uncertainty. Dashed lines are means and 95% coverage limits. The assays agreed within 2±11 μg l−1 MPO and varied in uncertainty by −2±12 μg l−1 MPO. (d) Results of the MAPS and CHL assays from 67 clinical plasma samples. Standardization unit disagreement limits analysis to correlation calculated, respectively, as Pearson r=0.90 and 0.86 when weighted and unweighted by combined uncertainty. (e) CHL results differ similarly from MAPS and protocol-matched ELISA. CHL-ELISA and CHL-MAPS disagreement is not significantly different across the cohort (generalized linear regression P=0.20). CHL data were converted to microgram per litre by an estimate for MPO molecular weight for direct comparison.

