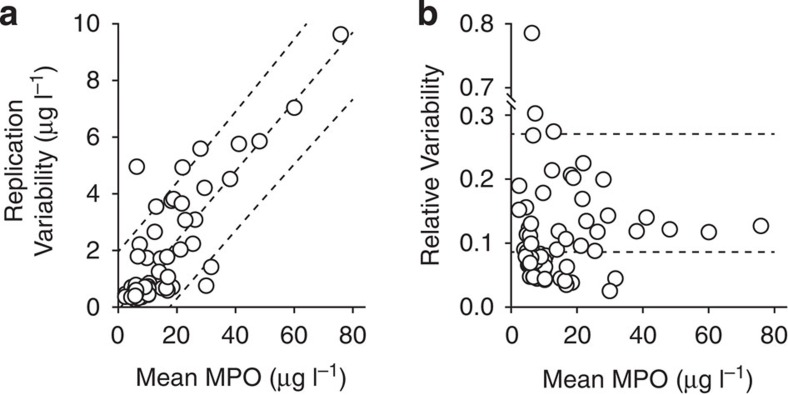
Figure 8. MAPS reproducibility.
MAPS assays independently replicated four times on 72 clinical plasma samples. Dashed lines show median and one-sided 95th percentile values. Computation details are provided in online methods. (a) Absolute replication variability quantified by accounting for both intra- and inter-replicate uncertainty. Median variability was 0.67 μg l−1 MPO, and 95% of samples were reproducible within 5.8 μg l−1 MPO. Variability was scaled with mean MPO by a factor of 0.12 (0.11–0.13). Dashed lines show mean and two-sided 95% coverage variability estimates. (b) Relative replication variability by normalization to variance-weighted replicate mean MPO. Median coefficient of variability was 8.6% with an upper 95th percentile threshold of 27%. Dashed lines show median and one-sided 95th percentile estimate.

