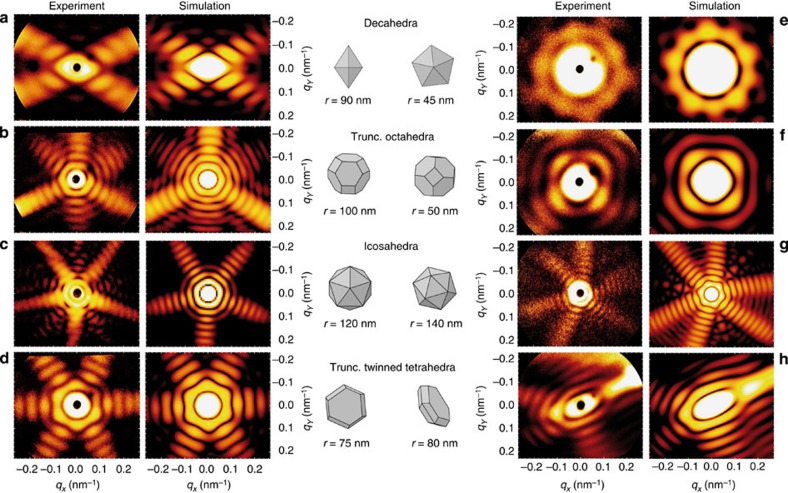
Figure 2. Comparison of measured and theoretical scattering images.
(a–d) Selected experimental scattering patterns of single Ag particles and MSFT simulation results for matched geometries (as indicated). False-colour images show the scattering intensity (logarithmic scale) as function of the transverse components of the scattering vector. The dark spot in the centre of the experimental data originates from a hole in the detector for direct beam transmission. Cluster shapes are drawn as seen from the direction of the incident beam. The size is given by the radius r of the polyhedra’s circumscribed sphere. (e–h) Same cluster shapes as in a–d imaged at different orientations with respect to the incident beam. Trunc, truncated.

