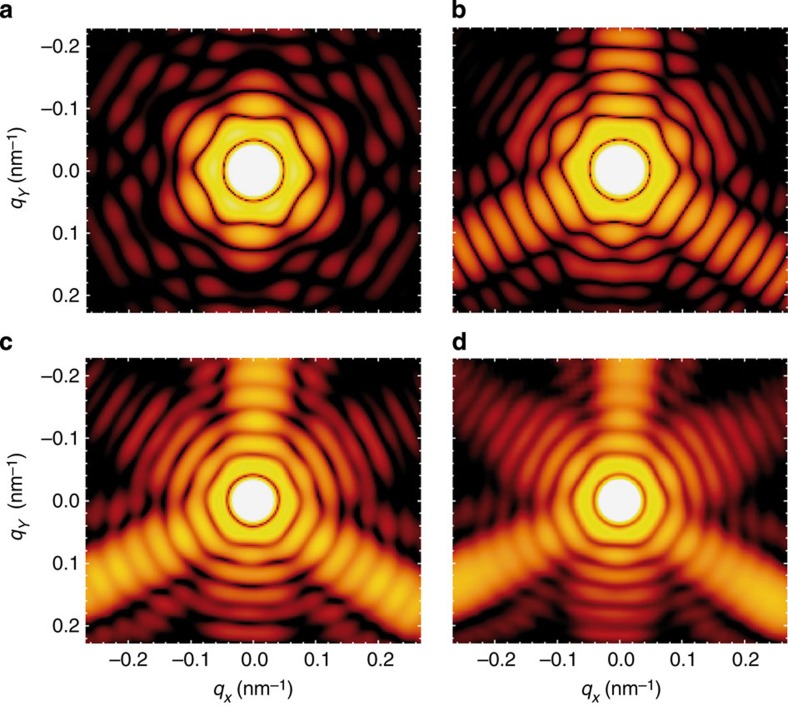
Figure 3. Comparison of different approximation levels.
False-colour images show the simulated scattering intensity (logarithmic scale) of a truncated octahedron (cf. Fig. 2b) as function of the transverse components of the scattering vector within different approximations. (a) Small-angle approximation corresponding to an effective scattering density projected onto a plane. (b) Born’s approximation taking into account the full 3D geometry but no absorption and refraction. (c) Same as b but including a simplified absorption model. (d) Full FDTD simulations using the optical properties of bulk-silver.

