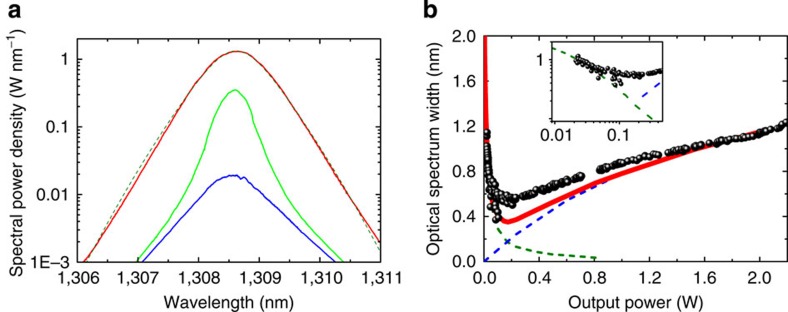
Figure 3. Non-linear kinetic description of the random fibre laser optical spectrum.
(a) Experimentally measured optical spectrum: near the generation threshold (blue curve, laser power=0.025 W), slightly above the generation threshold (green curve, 0.2 W) and well above the generation threshold (red curve, 1.5 W). The optical spectrum predicted by the local wave kinetic equation Supplementary Equation 43, for laser power 1.5 W is shown by dashed red line (b) Spectrum width as a function of the laser’s output power in theory and experiment. Experimental data are shown by black circles. The prediction for spectrum broadening from non-linear kinetic theory based on local wave kinetic equation (3) is shown by blue dashed line. The prediction for spectrum narrowing from modified linear kinetic Schawlow–Townes theory Supplementary Equation 47, is shown by dashed green line. Red line is a sum of non-linear and linear contributions. Inset—spectral narrowing near the threshold in a logarithmic scale.

