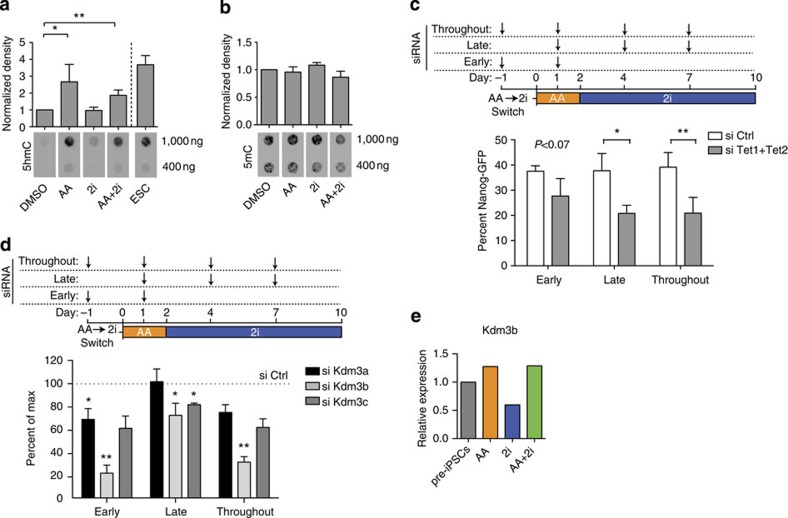
Figure 3. Histone demethylase effects of AA are essential early.
(a) Quantification of 5hmC levels normalized to DMSO control (top panel) of the dot blot of 5hmC levels (bottom panel) under DMSO, AA, 2i or AA+2i conditions for 2 days, compared with untreated ESC level. Error bars represent standard deviation of four biological replicates. Asterisk indicates significance *P<0.05, **P<0.01 assessed by t-test. (b) Quantification of 5mC levels normalized to DMSO control (top panel) of the dot blot of 5mC levels (bottom panel) under DMSO, AA, 2i or AA+2i conditions for 2 days. (c) Top panel—Scheme of the experiment: siRNA transfections targeting both Tet1 and Tet2 or control (anti-luciferase) were performed early (days −1 and +1), late (days +1, +4 and +7) or throughout (days −1, +1, +4 and +7). Day of exposure to media containing AA alone was day 0. On day 2, media were switched to that containing 2i alone. Bottom panel—Quantification of Nanog-GFP-positive cells obtained on day 10 of the experiment. Error bars represent standard deviation from three biological replicates. Asterisk indicates significance *P<0.05, **P<0.01 assessed by t-test. (d) Top panel—Scheme of the experiment: siRNA transfections targeting histone demethylases or control (anti-luciferase) were performed early (days −1 and +1), late (days +1, +4 and +7) or throughout (days −1, +1, +4 and +7). Day of exposure to media containing AA alone was day 0. On day 2, media were switched to that containing 2i alone. Bottom panel—Quantification of Nanog-GFP-positive cells obtained on day 10 of the experiment upon knockdown of specific H3K9me1/me2 demethylases. Dotted line represents Nanog-GFP-positive levels obtained in control siRNA conditions set to 100%. Error bars represent standard deviation from three biological replicates. Asterisk indicates significance *P<0.05, **P<0.01 assessed by t-test. (e) Relative expression of Kdm3b in pre-iPSC treated with AA, 2i or AA+2i for 24 h.

