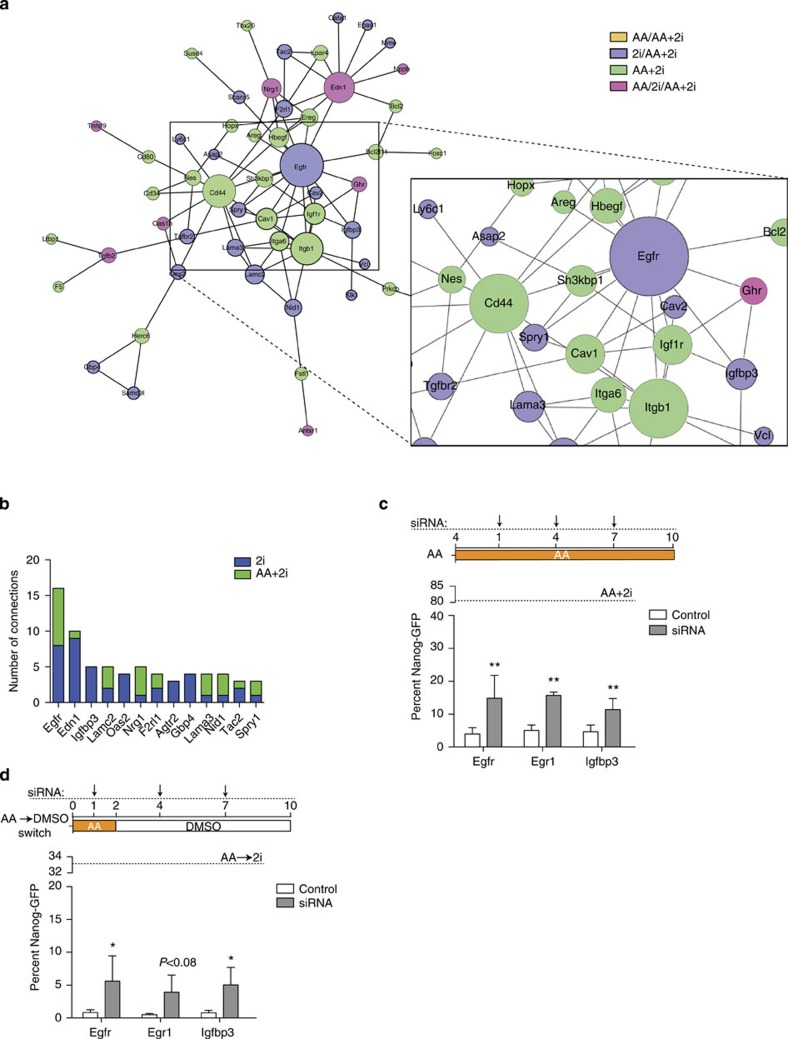
Figure 6. 2i downregulated nodes are barriers to reprogramming.
(a) Networks generated from overlaying downregulated gene expression data onto protein interaction from the STRING database. A zoomed-in view of the Egfr node and its edges is presented. Orange=shared between the AA+2i and AA network, blue=shared between the AA+2i and 2i networks, green=unique to the AA+2i network, pink=shared in all networks. (b) Bar graph of downregulated nodes shared by 2i (blue) and AA+2i (green). The number of edges for each node is indicated on the y axis. (c) Top panel—Scheme of the experiment: siRNA transfections targeting genes identified as key downregulated nodes or control (anti-luciferase) were performed on days +1, +4 and +7. Day of exposure to media containing AA alone was day 0. Bottom panel—Quantification of Nanog-GFP-positive cells obtained on day 10. Dotted line represents the per cent Nanog-GFP-positive cell levels obtained in control treatment (AA+2i). Error bars represent standard deviation from two to four biological replicates. **P<0.01 assessed by t-test. (d) Top panel—Scheme of the experiment: siRNA transfections targeting genes identified as key downregulated nodes or control (anti-luciferase) were performed on days +1, +4 and +7. Cells were treated with AA between day 0 and day 2 before switching to DMSO containing media until day 10. Bottom panel—Quantification of Nanog-GFP-positive cells obtained on day 10. Dotted line represents Nanog-GFP-positive levels obtained in control treatment (AA switched to 2i). Error bars represent standard deviation from three to five biological replicates. Asterisk indicates significance *P<0.05 assessed by t-test.

