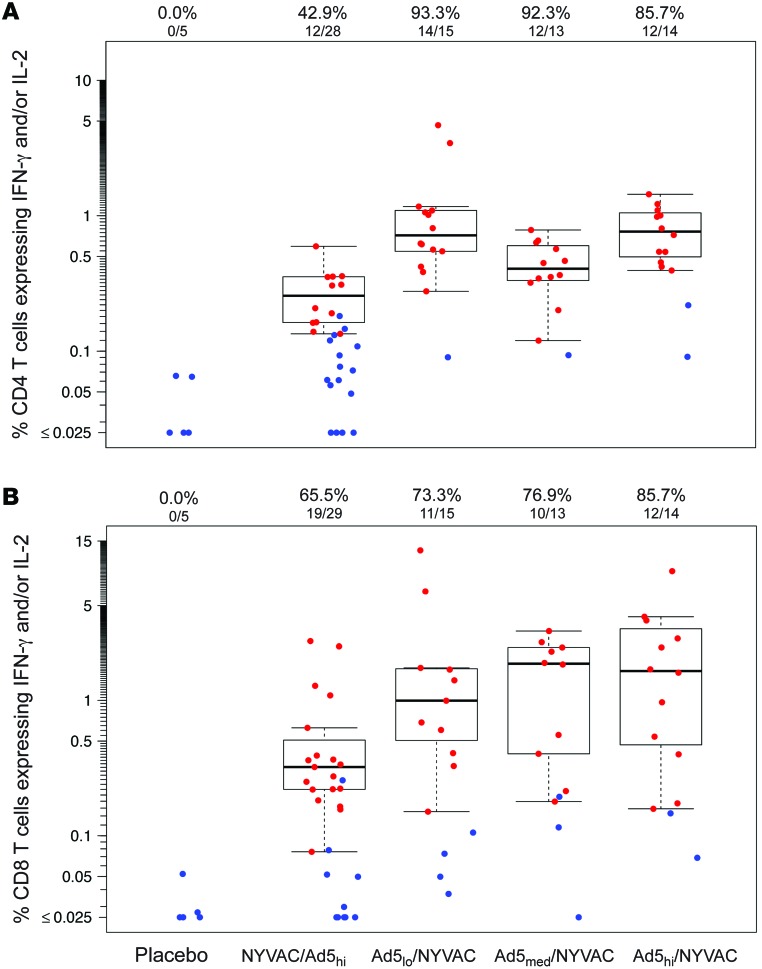
Figure 8. T cell responses elicited in HVTN 078.
CD4+ (A) and CD8+ (B) T cell responses were measured 2 weeks after the final vaccination by ICS and reported as the percentage of CD4+ or CD8+ T cells producing IFN-γ and/or IL-2 for placebo recipients (combined for groups 1–4) and vaccinees in each treatment group. Positive responses are shown in red symbols and negative responses in blue. Boxes and whiskers represent positive responders only (see Methods). N, NYVAC-B; P, placebo; Ad, rAd5; Lo, 108 rAd5 PFU; Med, 109 rAd5 PFU; Hi, 1010 rAd5 PFU.

